OPEN-SOURCE SCRIPT
SMA 10 & 50
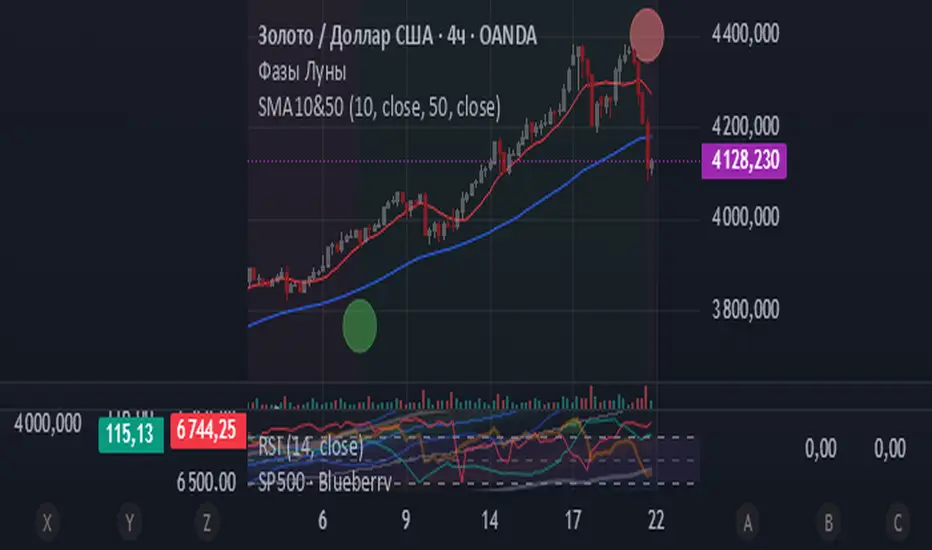
SMA10&50
SMA 10 & 50 is a simple dual moving average indicator that plots two Simple Moving Averages (SMA) on the price chart: SMA10 and SMA50.
Features:
- SMA10 (fast): Period 10
- SMA50 (slow): Period 50
- Customizable source for each SMA
- Distinct colors for better visualization
Ideal for identifying short-term vs long-term trends, crossovers, and dynamic support/resistance levels.
Open-source script
In true TradingView spirit, the creator of this script has made it open-source, so that traders can review and verify its functionality. Kudos to the author! While you can use it for free, remember that republishing the code is subject to our House Rules.
Disclaimer
The information and publications are not meant to be, and do not constitute, financial, investment, trading, or other types of advice or recommendations supplied or endorsed by TradingView. Read more in the Terms of Use.