OPEN-SOURCE SCRIPT
Updated Institutional Absorption
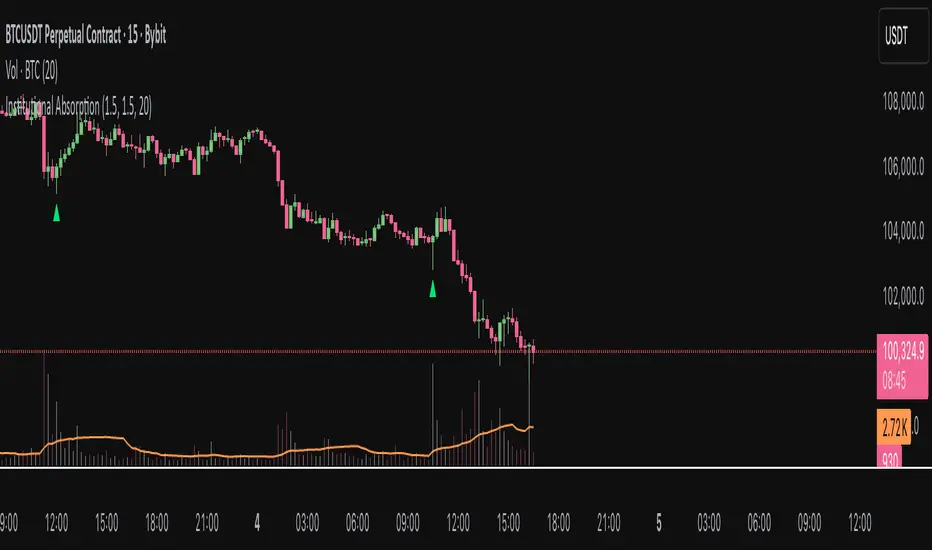
Highlights potential zones where institutional participants may be absorbing aggressive buying or selling pressure.
It analyzes candle structure and volume to detect possible bullish and bearish absorption events, providing a visual cue for traders studying market imbalance and liquidity dynamics.
The script compares each candle’s wick–body ratio and volume relative to its moving average.
A bullish absorption setup occurs when strong volume appears after a sharp downward move with long lower wicks, while bearish absorption occurs after upward moves with long upper wicks, suggesting the presence of large counter-orders.
+ Features
Detects bullish and bearish absorption candles.
Customizable wick to body ratio and volume multiple thresholds.
Optional filter to require candle color alignment with trend (green/red).
Option to ignore tiny body (doji-like) candles.
+ How to Use
Adjust wick–body ratio, volume multiplier, and lookback length under “Conditions (Absorption)”.
Enable “Require candle color” to strengthen directional context.
Use alerts to receive notifications when new absorption signals appear.
+ Notes
This tool aims to visualize possible absorption behavior, not confirm institutional activity.
Combine it with your broader market structure, volume, or order flow analysis for a more comprehensive analysis.
Release Notes
Revision 1Open-source script
In true TradingView spirit, the creator of this script has made it open-source, so that traders can review and verify its functionality. Kudos to the author! While you can use it for free, remember that republishing the code is subject to our House Rules.
Disclaimer
The information and publications are not meant to be, and do not constitute, financial, investment, trading, or other types of advice or recommendations supplied or endorsed by TradingView. Read more in the Terms of Use.
Open-source script
In true TradingView spirit, the creator of this script has made it open-source, so that traders can review and verify its functionality. Kudos to the author! While you can use it for free, remember that republishing the code is subject to our House Rules.
Disclaimer
The information and publications are not meant to be, and do not constitute, financial, investment, trading, or other types of advice or recommendations supplied or endorsed by TradingView. Read more in the Terms of Use.