PROTECTED SOURCE SCRIPT
ATR + Fibs
Description:
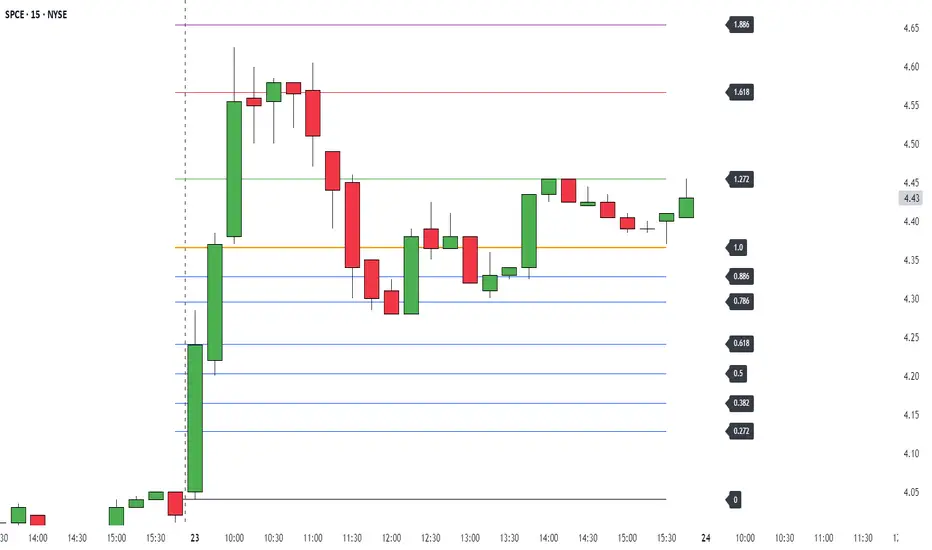
This script plots ATR levels and ATR-based Fibonacci extension levels from either the Low of Day, or High of Day, using the daily Average True Range (ATR) to project key price zones. It's designed to help traders quickly assess where price is trading relative to the day’s ATR.
Features:
Visual reference for how far price has moved relative to today's ATR
Projects fib levels using daily ATR from LOD or HOD
Optional display of fib lines, % labels, and price values
Customizable colors and line widths per level
Auto-resets daily with updated highs/lows
Works on all intraday and higher timeframes
Ideal for traders who want to gauge intraday extension, or frame entries using volatility-based levels.
Protected script
This script is published as closed-source. However, you can use it freely and without any limitations – learn more here.
Disclaimer
The information and publications are not meant to be, and do not constitute, financial, investment, trading, or other types of advice or recommendations supplied or endorsed by TradingView. Read more in the Terms of Use.