OPEN-SOURCE SCRIPT
EMA Deviation with Min/Max Levels

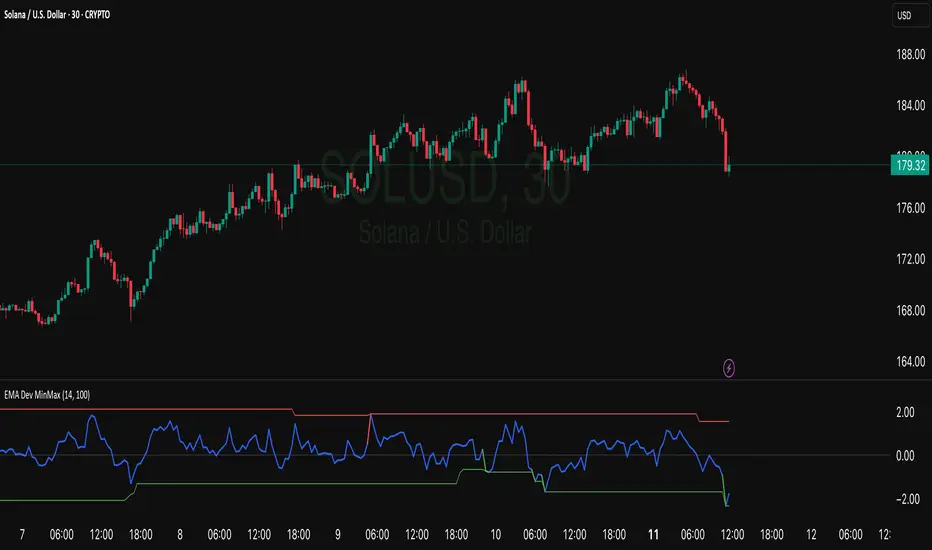
his indicator visualizes the percentage deviation of the closing price from its Exponential Moving Average (EMA), helping traders identify overbought and oversold conditions. It dynamically tracks the minimum and maximum deviation levels over a user-defined lookback period, highlighting extreme zones with color-coded signals:
• 🔵 Normal deviation range
• 🔴 Near historical maximum — potential sell zone
• 🟢 Near historical minimum — potential buy zone
Use it to spot price extremes relative to trend and anticipate possible reversals or mean reversion setups.
• 🔵 Normal deviation range
• 🔴 Near historical maximum — potential sell zone
• 🟢 Near historical minimum — potential buy zone
Use it to spot price extremes relative to trend and anticipate possible reversals or mean reversion setups.
Open-source script
In true TradingView spirit, the creator of this script has made it open-source, so that traders can review and verify its functionality. Kudos to the author! While you can use it for free, remember that republishing the code is subject to our House Rules.
Disclaimer
The information and publications are not meant to be, and do not constitute, financial, investment, trading, or other types of advice or recommendations supplied or endorsed by TradingView. Read more in the Terms of Use.