OPEN-SOURCE SCRIPT
Currency Pair Index Indicator

Here's how it works step by step:
The indicator takes an input parameter called "length," which determines the number of bars to consider for the calculation. A higher length value will result in a smoother indicator, while a lower length value will make it more sensitive to recent price changes.
It then calculates the bullish sentiment by summing the volume multiplied by the price change (close - open) for each bar where the close price is greater than the open price. If the close price is not greater than the open price, the value for that bar is set to zero. The sum of these values is divided by the total volume for the selected bars.
Similarly, the bearish sentiment is calculated by summing the volume multiplied by the price change (open - close) for each bar where the close price is less than the open price. If the close price is not less than the open price, the value for that bar is set to zero. The sum of these values is divided by the total volume for the selected bars.
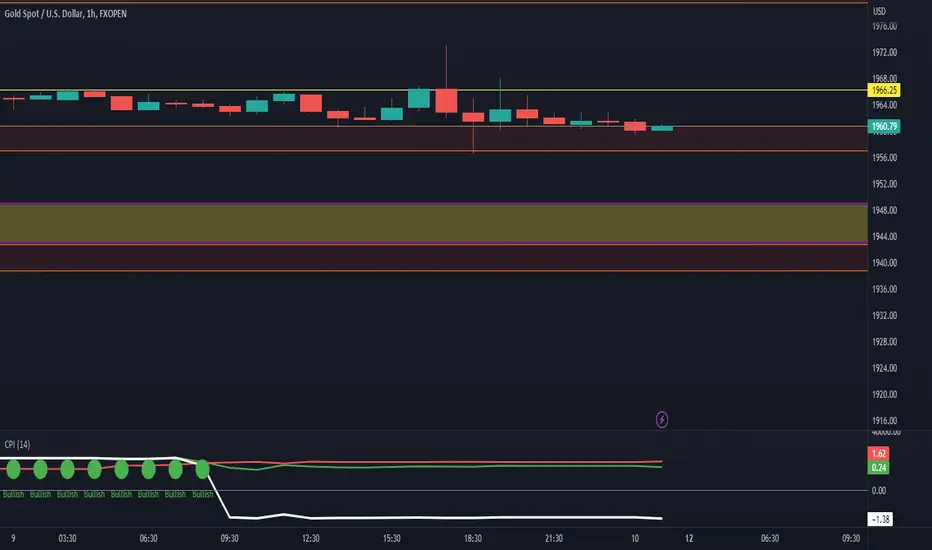
The bullish and bearish values are then plotted on the chart as separate line graphs. The bullish sentiment is represented by a green line, while the bearish sentiment is represented by a red line.
The difference between the bullish and bearish values is also plotted as a blue line. This line represents the overall sentiment of the currency pair index.
Additionally, arrow symbols are plotted below the price bars to indicate bullish or bearish signals. A green arrow is displayed when the bullish sentiment is higher than the bearish sentiment, indicating a bullish signal. A red arrow is displayed when the bearish sentiment is higher than the bullish sentiment, indicating a bearish signal.
By observing the indicator's line graphs and arrow symbols, traders can get an idea of the overall sentiment of the currency pair and identify potential bullish or bearish trading opportunities.
Open-source script
In true TradingView spirit, the creator of this script has made it open-source, so that traders can review and verify its functionality. Kudos to the author! While you can use it for free, remember that republishing the code is subject to our House Rules.
Disclaimer
The information and publications are not meant to be, and do not constitute, financial, investment, trading, or other types of advice or recommendations supplied or endorsed by TradingView. Read more in the Terms of Use.