OPEN-SOURCE SCRIPT
Updated On Balance Volume Modified
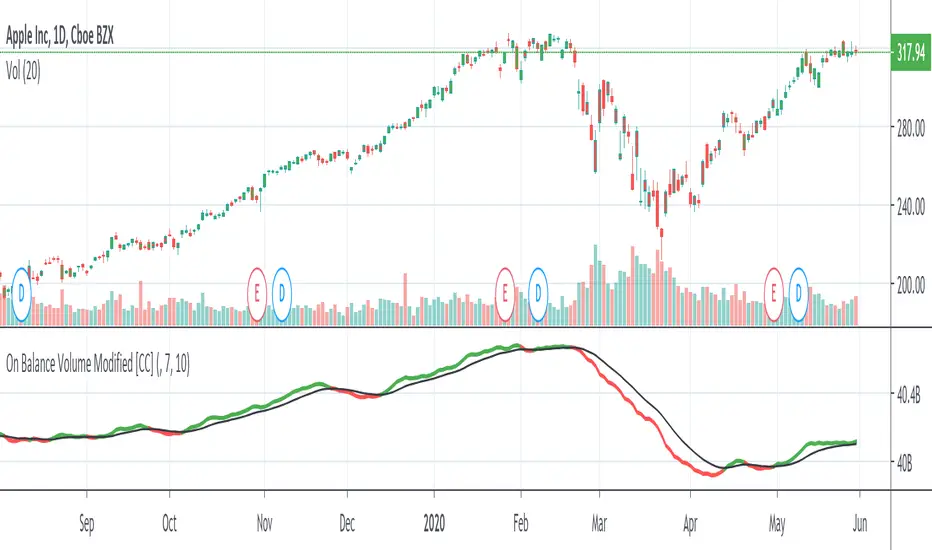
Here is a smoothed version of the classic OBV indicator with a signal line. You can use it to look for signal line crossovers and divergences. The signal line is a 10-day EMA of the OBVM line. Typically, the signal line can vary from 10 to 50.
This was just published by Vitali Apirine in the latest issue of Stocks & Commodities (April 2020) p22-25
Please let me know if you want me to publish any other indicators or if you have any questions!
This was just published by Vitali Apirine in the latest issue of Stocks & Commodities (April 2020) p22-25
Please let me know if you want me to publish any other indicators or if you have any questions!
Release Notes
updated to match my other indicatorsRelease Notes
fixed issue with default resolutionOpen-source script
In true TradingView spirit, the creator of this script has made it open-source, so that traders can review and verify its functionality. Kudos to the author! While you can use it for free, remember that republishing the code is subject to our House Rules.
Disclaimer
The information and publications are not meant to be, and do not constitute, financial, investment, trading, or other types of advice or recommendations supplied or endorsed by TradingView. Read more in the Terms of Use.
Open-source script
In true TradingView spirit, the creator of this script has made it open-source, so that traders can review and verify its functionality. Kudos to the author! While you can use it for free, remember that republishing the code is subject to our House Rules.
Disclaimer
The information and publications are not meant to be, and do not constitute, financial, investment, trading, or other types of advice or recommendations supplied or endorsed by TradingView. Read more in the Terms of Use.