OPEN-SOURCE SCRIPT
Updated SMADIF4 Indicator
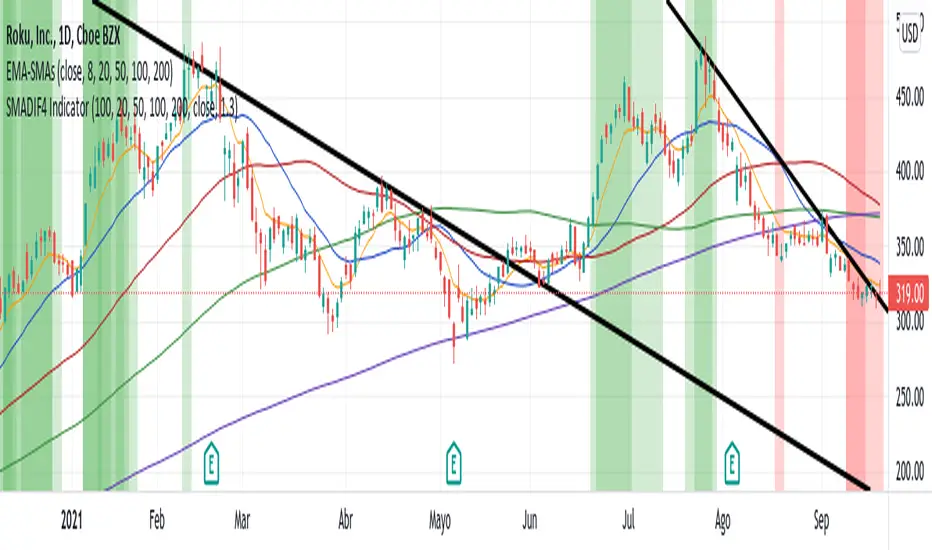
It shows a percentage difference between close and 4-SMA, 20, 50, 100 and 200. As it turns greener, the stock is more expensive, and vice versa, it turns redder when it becomes cheaper relative to the SMA. It will print the green backgraound as long as the bar closes above the 200 SMA and red as long as the bar closes below the 200 SMA. It uses by default 1.3 sigma to discriminate non-representative values and 100 bars in the past.
Release Notes
Algunas definiciones en el codigoRelease Notes
Description in color screen configurationOpen-source script
In true TradingView spirit, the creator of this script has made it open-source, so that traders can review and verify its functionality. Kudos to the author! While you can use it for free, remember that republishing the code is subject to our House Rules.
Disclaimer
The information and publications are not meant to be, and do not constitute, financial, investment, trading, or other types of advice or recommendations supplied or endorsed by TradingView. Read more in the Terms of Use.
Open-source script
In true TradingView spirit, the creator of this script has made it open-source, so that traders can review and verify its functionality. Kudos to the author! While you can use it for free, remember that republishing the code is subject to our House Rules.
Disclaimer
The information and publications are not meant to be, and do not constitute, financial, investment, trading, or other types of advice or recommendations supplied or endorsed by TradingView. Read more in the Terms of Use.