OPEN-SOURCE SCRIPT
Extreme Volumes
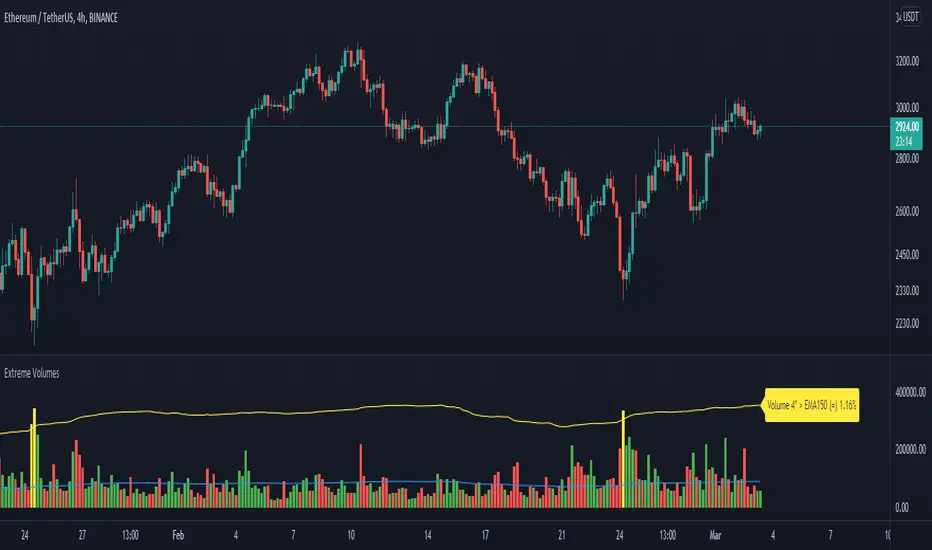
The aim of this volume indicator is quite simple: to pinpoint extreme volume spikes and how unusual these extremes are in comparison to all the chart's volumes.
The label displayed at the end of the indicator updates according to the settings you choose;
It shows the volume EMA length and how many times (the EMA) the current volume bar as to be above to be considered extreme.
Finally, the percentage at the end of the label tells how unusual the defined extreme volumes are compared to the whole chart's volumes (the smaller the percentage, the more unusual these "extreme" volumes are).
Open-source script
In true TradingView spirit, the creator of this script has made it open-source, so that traders can review and verify its functionality. Kudos to the author! While you can use it for free, remember that republishing the code is subject to our House Rules.
Disclaimer
The information and publications are not meant to be, and do not constitute, financial, investment, trading, or other types of advice or recommendations supplied or endorsed by TradingView. Read more in the Terms of Use.