OPEN-SOURCE SCRIPT
Multiple Smoothed Moving Averages
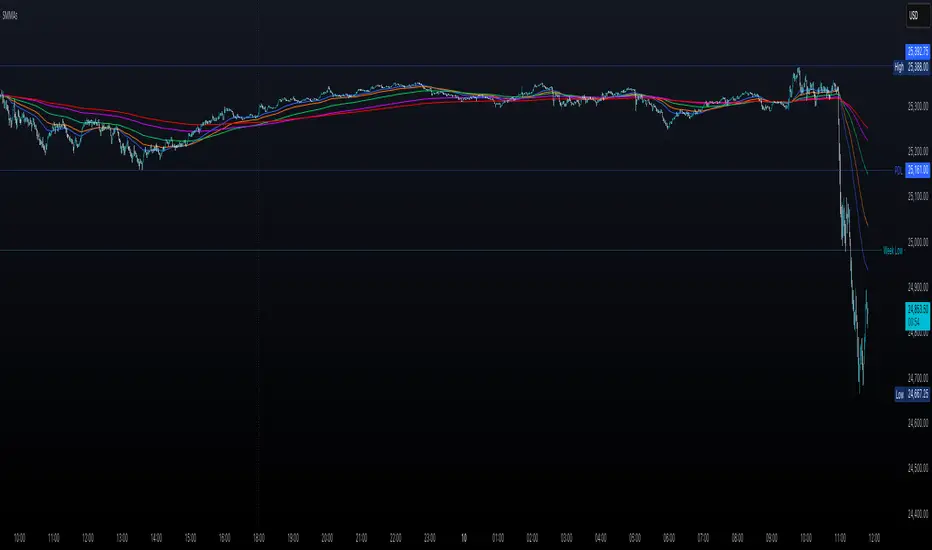
Multiple Smoothed Moving Averages (SMMAs)
This indicator displays up to 5 Smoothed Moving Averages (SMMAs) on your chart, providing a comprehensive view of multiple trend timeframes simultaneously.
═══════════════════════════════════════
WHAT IS A SMOOTHED MOVING AVERAGE?
═══════════════════════════════════════
The Smoothed Moving Average (SMMA), also known as the Running Moving Average (RMA), is a type of moving average that provides more smoothing than a Simple Moving Average (SMA).
Unlike SMA which gives equal weight to all values in the period, SMMA uses a recursive formula that gives more weight to previous SMMA values, resulting in:
- Smoother price action with less noise
- Slower response to recent price changes
- Better identification of longer-term trends
- Reduced false signals in choppy markets
CALCULATION METHOD:
- First value: Simple Moving Average of the initial period
- Subsequent values: (Previous SMMA × (Length - 1) + Current Price) / Length
This recursive nature makes SMMA particularly effective for identifying sustained trends while filtering out short-term volatility.
═══════════════════════════════════════
FEATURES
═══════════════════════════════════════
✓ 5 Independent SMMAs: Each with its own configurable period length
✓ Individual Toggles: Show/hide each SMMA independently
✓ Distinct Colors: Easy visual identification of each moving average
✓ Customizable Lengths: Adjust each period to match your trading strategy
✓ Shared Source: All SMMAs calculate from the same price source (default: close)
✓ Overlay Display: Plots directly on the price chart
═══════════════════════════════════════
DEFAULT SETTINGS
═══════════════════════════════════════
- SMMA 1: 30 periods (Blue)
- SMMA 2: 50 periods (Orange)
- SMMA 3: 100 periods (Green)
- SMMA 4: 200 periods (Purple)
- SMMA 5: 300 periods (Red)
All SMMAs are enabled by default.
═══════════════════════════════════════
HOW TO USE
═══════════════════════════════════════
TREND IDENTIFICATION:
- Price above all SMMAs = Strong uptrend
- Price below all SMMAs = Strong downtrend
- Price between SMMAs = Transitional phase or consolidation
SUPPORT & RESISTANCE:
- SMMAs often act as dynamic support in uptrends
- SMMAs often act as dynamic resistance in downtrends
- Longer-period SMMAs (200, 300) provide stronger S/R levels
CROSSOVER SIGNALS:
- Faster SMMA crossing above slower SMMA = Bullish signal
- Faster SMMA crossing below slower SMMA = Bearish signal
MULTIPLE TIMEFRAME ANALYSIS:
- Short-term trends: 30, 50 periods
- Medium-term trends: 100 periods
- Long-term trends: 200, 300 periods
═══════════════════════════════════════
CUSTOMIZATION
═══════════════════════════════════════
INPUTS TAB:
- Adjust each SMMA length to suit your trading timeframe
- Toggle individual SMMAs on/off using checkboxes
- Change the source (close, open, high, low, hl2, hlc3, ohlc4)
STYLE TAB:
- Modify line colors for each SMMA
- Adjust line thickness and style
- Change transparency levels
═══════════════════════════════════════
NOTES
═══════════════════════════════════════
- This indicator uses the mathematically correct SMMA calculation with the recursive formula
- All calculations are performed on every bar to ensure data consistency
- SMMAs respond more slowly than EMAs but faster than WMAs to price changes
- Best used in combination with other technical analysis tools
- Use on any timeframe
═══════════════════════════════════════
Perfect for traders who want a clear, multi-timeframe view of market trends using the smooth, reliable SMMA calculation method.
Open-source script
In true TradingView spirit, the creator of this script has made it open-source, so that traders can review and verify its functionality. Kudos to the author! While you can use it for free, remember that republishing the code is subject to our House Rules.
Disclaimer
The information and publications are not meant to be, and do not constitute, financial, investment, trading, or other types of advice or recommendations supplied or endorsed by TradingView. Read more in the Terms of Use.