OPEN-SOURCE SCRIPT
Sharpe Ratio Indicator (180)
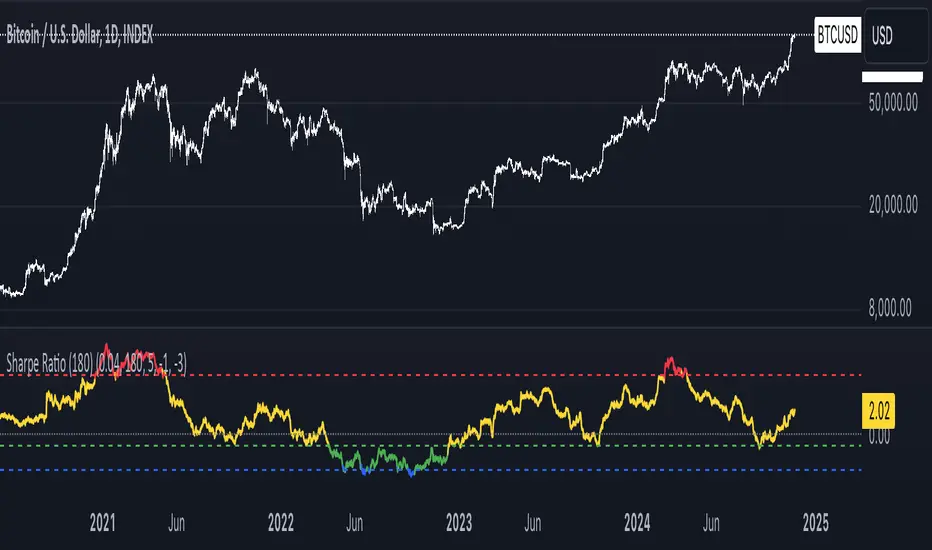
Meant to be used on the 1D chart and on BTC.
The Sharpe Ratio Indicator (180 days) is a tool for evaluating risk-adjusted returns, designed for investors who want to assess whether BTC is overvalued, undervalued, or in a neutral state. It plots the Sharpe Ratio over the past 180 days, color-coded to indicate valuation states:
- Red: Overvalued (Sharpe Ratio > 5).
- Green: Undervalued (Sharpe Ratio < -1).
-Blue: Critically Undervalued (Sharpe Ratio <-3).
- Yellow: Neutral (between -1 and 5).
Note that you can change those values yourself in the settings of the indicator.
Strengths:
- Real-time feedback on risk-adjusted returns helps in making timely investment decisions.
- Color-coded signals (red, green, blue and yellow) provide an intuitive, visual indication of the asset's valuation.
- Flexible: Easily adjustable to different subjective valuation levels and risk-free rates.
All hail to Professor Adam and The Real World Community!
Open-source script
In true TradingView spirit, the creator of this script has made it open-source, so that traders can review and verify its functionality. Kudos to the author! While you can use it for free, remember that republishing the code is subject to our House Rules.
Disclaimer
The information and publications are not meant to be, and do not constitute, financial, investment, trading, or other types of advice or recommendations supplied or endorsed by TradingView. Read more in the Terms of Use.