OPEN-SOURCE SCRIPT
Updated TI65
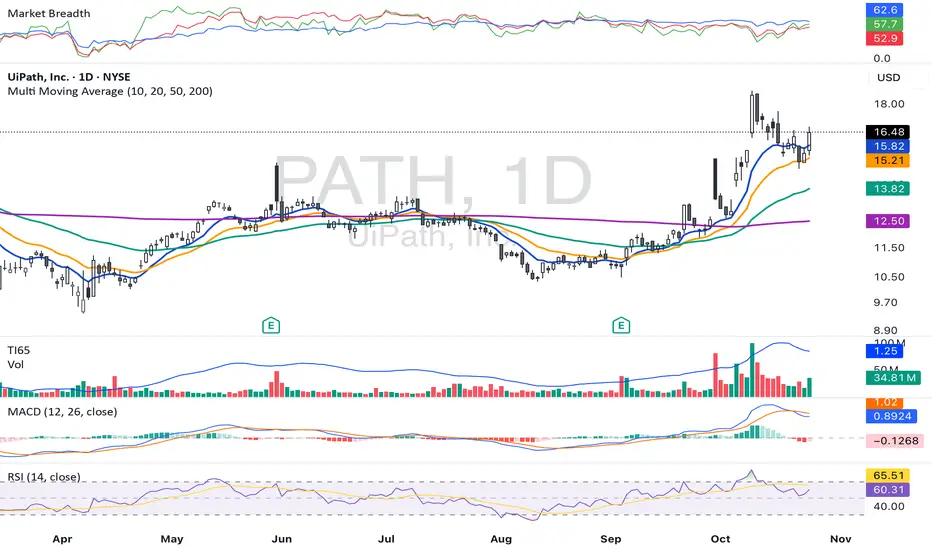
**TI65 (Trend Intensity 65)** is a technical indicator designed to measure the strength and momentum of a trend over two distinct periods. It compares a short-term 7-period simple moving average (SMA) with a long-term 65-period SMA, producing a ratio that helps traders identify shifts in market momentum and trend direction.
- When the **TI65 value is greater than 1**, it indicates that the short-term moving average is above the long-term average, suggesting increasing momentum and a potentially bullish trend.
- When the **TI65 value drops below 1**, it signals weakening short-term momentum relative to the longer-term trend, often interpreted as a bearish or consolidating phase.
This indicator can be applied to both price and volume data, making it useful for identifying periods of strong volume surges or price movements. By observing changes in the TI65 ratio, traders can pinpoint low-risk entry points for trend-following strategies and quickly recognize periods of market transition.
TI65 is commonly used by momentum and breakout traders for screening strong candidates and confirming the sustainability of ongoing trends. It is simple, effective, and easily implemented via custom scripts on popular platforms like TradingView.
Release Notes
Replaced original TI65 (7-period SMA / 65-period SMA) with a faster, more responsive variant: TI60 (8-period SMA / 60-period SMA). This adjustment shortens the long-term reference from ~3 months to ~2.5 months, increasing sensitivity to early trend shifts — ideal for volatile assets like MSOS.
Thresholds refined: bullish above 1.08, bearish below 0.92. TI60 line now overlays the volume subplot for direct price-momentum vs. liquidity comparison.
Open-source script
In true TradingView spirit, the creator of this script has made it open-source, so that traders can review and verify its functionality. Kudos to the author! While you can use it for free, remember that republishing the code is subject to our House Rules.
Disclaimer
The information and publications are not meant to be, and do not constitute, financial, investment, trading, or other types of advice or recommendations supplied or endorsed by TradingView. Read more in the Terms of Use.