OPEN-SOURCE SCRIPT
Updated Ribbon % OF stocks above 20/50/100/200 DayMA S&P500
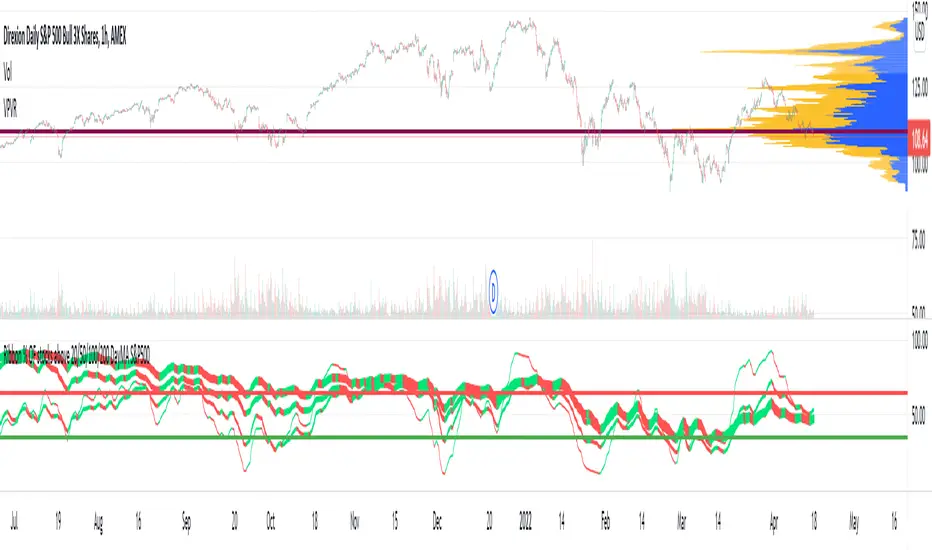
Moving average ribbon of % stocks above 20/50/100/200 Day moving average in th S&P500. Directional color. Pretty good indicator for big bottoms. Tops - not so much. use 1D timeframe.
Release Notes
Ribbon % OF stocks above 20/50/100/200 DayMA S&P500 color fixes.Open-source script
In true TradingView spirit, the creator of this script has made it open-source, so that traders can review and verify its functionality. Kudos to the author! While you can use it for free, remember that republishing the code is subject to our House Rules.
Disclaimer
The information and publications are not meant to be, and do not constitute, financial, investment, trading, or other types of advice or recommendations supplied or endorsed by TradingView. Read more in the Terms of Use.
Open-source script
In true TradingView spirit, the creator of this script has made it open-source, so that traders can review and verify its functionality. Kudos to the author! While you can use it for free, remember that republishing the code is subject to our House Rules.
Disclaimer
The information and publications are not meant to be, and do not constitute, financial, investment, trading, or other types of advice or recommendations supplied or endorsed by TradingView. Read more in the Terms of Use.