OPEN-SOURCE SCRIPT
Updated Auto Daily Fib Levels R2 by JustUncleL
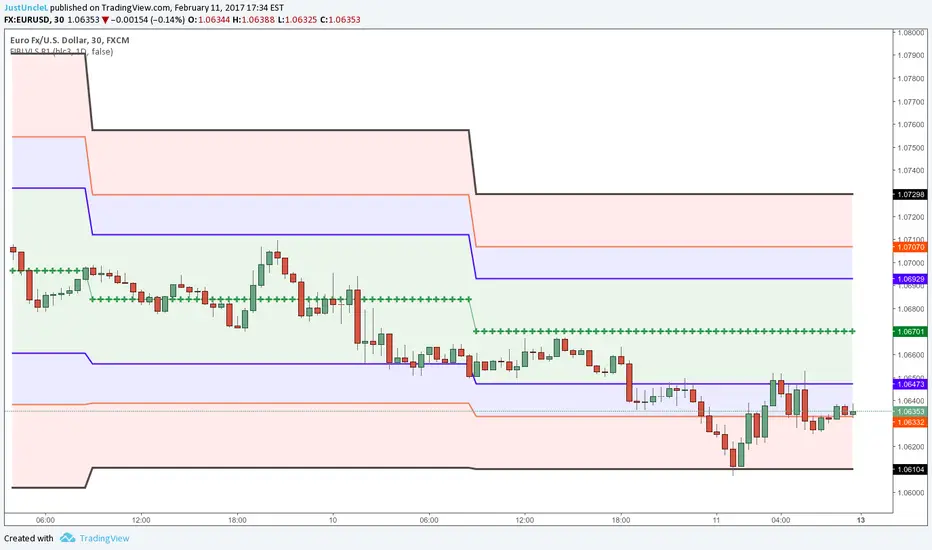
This study is a variation of my "Automatic Daily Fibonnacci" indicator. This variation automatically draw Fibonacci Pivot levels (or optionally Classic Pivots) based on the previous day's highest and lowest points. The HLC3 is used as the default Daily Pivot level.
Unlike the "Automatic Daily Fibonnacci", this indicator does not redraw/update levels on current day even if the price goes past the R3/S3 levels.
Timeframe: is just a text string and is not checked, so needs to be a valid resolution eg: 60, 120, 240, 360, 480, 720, 1D, 1W, 1M, 2D, 2W, 3M
Pivot LEVELS:
- Green = Pivot and Pivot Zone
- Blue = R1,S1 Levels and Zone
- Red = R2,S2 Levels and Zone
- Black = R3,S3 Levels
Release Notes
Revision 2.5 Update- Added 0.786 Levels
- Added Optional Extended Levels
- Added Option to Show Today's Pivots Only.
- Removed Zone colouring except Centre Pivot Zone
- Modified Default Colours
here is the Today's Only Pivot Option
Release Notes
R3 Updates- Modified the way "Today's Pivots" only is display, now only show levels in the current day's price action.
- Added option to display current days open price.
- Changed security calls to use "ticker" instead of "tickerid", this should allow indicator to be used with Renko charts.
Open-source script
In true TradingView spirit, the creator of this script has made it open-source, so that traders can review and verify its functionality. Kudos to the author! While you can use it for free, remember that republishing the code is subject to our House Rules.
JustUncleL
Disclaimer
The information and publications are not meant to be, and do not constitute, financial, investment, trading, or other types of advice or recommendations supplied or endorsed by TradingView. Read more in the Terms of Use.