PROTECTED SOURCE SCRIPT
Crimson/Grover Sine Cycle

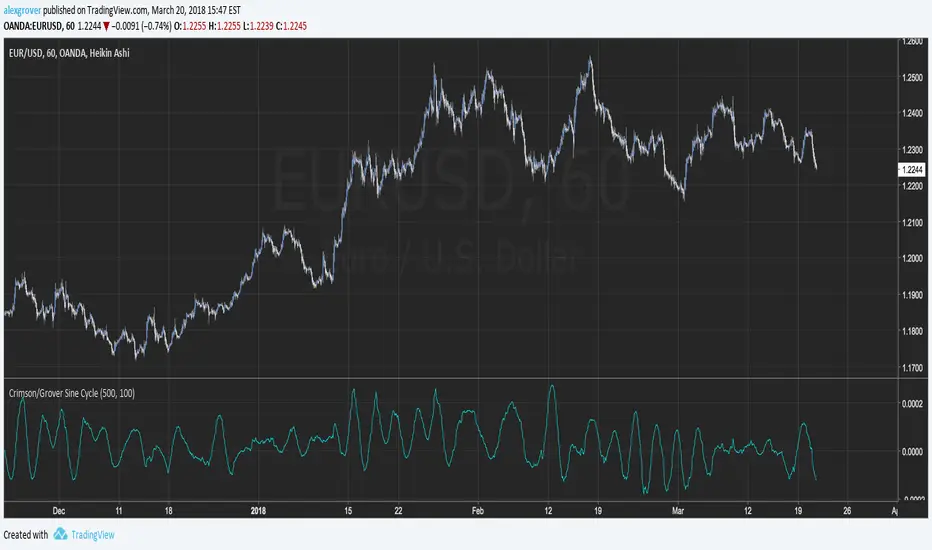
There is plenty of indicators trying to show cycles in price, the majority of them create a stationary version of the price and then smooth it, the Crimson/Grover cycle use as source a pure sine wave of period crimson and then use a best fit line with y = price and x = sine wave.Some final transformations are mades for highlights the cycle of the price.
The length parameter control the regression period and the crimson parameter the period of the sine cycle.If the length is higher than the crimson period then the indicator is more smoother but give more liberty to the sine wave.
The period of sine wave is equal to period/(2*3.14).

A sine wave of period 100
For any questions regarding the indicator please contact me :)
The length parameter control the regression period and the crimson parameter the period of the sine cycle.If the length is higher than the crimson period then the indicator is more smoother but give more liberty to the sine wave.
The period of sine wave is equal to period/(2*3.14).
A sine wave of period 100
For any questions regarding the indicator please contact me :)
Protected script
This script is published as closed-source. However, you can use it freely and without any limitations – learn more here.
Check out the indicators we are making at luxalgo: tradingview.com/u/LuxAlgo/
"My heart is so loud that I can't hear the fireworks"
"My heart is so loud that I can't hear the fireworks"
Disclaimer
The information and publications are not meant to be, and do not constitute, financial, investment, trading, or other types of advice or recommendations supplied or endorsed by TradingView. Read more in the Terms of Use.