OPEN-SOURCE SCRIPT
Updated Non-commercial Interest Percent Comparison Other

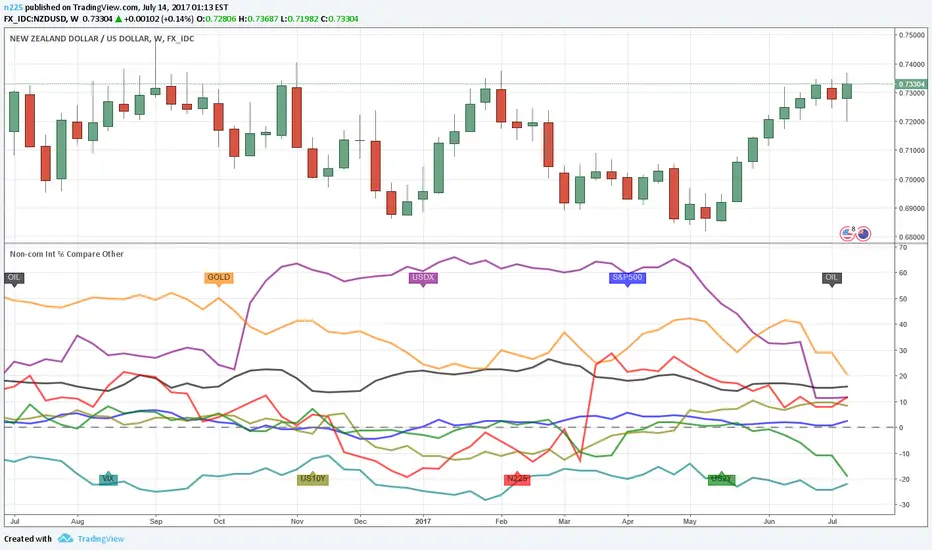
This script compares IMM CFTC net positioning in percentage terms for several instruments.
Load it onto any weekly chart. The data displayed is independent of the chart instrument.
On the Inputs tab, uncheck "Show Legend" to hide the legend (useful if you want to change the plot colours or it is getting in the way).
On the Inputs tab, select "Total OI" to show the net positions expressed as a percentage of Total Open Interest; or "Non-com positions" to show them expressed as a percentage of Non-commercial Longs + Shorts. The default is "Total OI".
On the Style tab, change the plot colours, etc. as necessary. Note that the legend will not reflect the new colours.
This is my first script and I couldn't get some things working as I wanted (such as multi-line declared functions and if-then-else blocks), so sorry the code's a bit clunky. Please feel free to copy and modify it however you wish.
An FX version is also available.
Release Notes
V2 17-Jul-2017 Changed security resolution to "W" (weekly) and set lookahead=barmerge.lookahead_on to allow latest CFTC data to be seen at a weekend before next weekly bar opens.Release Notes
Changed security function parameters to allow latest CFTC data to be seen at a weekend (before next weekly bar opens).Release Notes
Third attempt at trying to update my script (it kept saying it violated one or more House Rules but I've no idea which ones). I've simply changed the call to the security function to allow the latest data from Quandl to be seen at a weekend, before the next weekly bar opens.Release Notes
Fourth attempt. See above.Release Notes
Still can't publish. Removing explicit parameter to see if that works.Release Notes
Reverting back to original. Last attempt.Open-source script
In true TradingView spirit, the creator of this script has made it open-source, so that traders can review and verify its functionality. Kudos to the author! While you can use it for free, remember that republishing the code is subject to our House Rules.
Disclaimer
The information and publications are not meant to be, and do not constitute, financial, investment, trading, or other types of advice or recommendations supplied or endorsed by TradingView. Read more in the Terms of Use.
Open-source script
In true TradingView spirit, the creator of this script has made it open-source, so that traders can review and verify its functionality. Kudos to the author! While you can use it for free, remember that republishing the code is subject to our House Rules.
Disclaimer
The information and publications are not meant to be, and do not constitute, financial, investment, trading, or other types of advice or recommendations supplied or endorsed by TradingView. Read more in the Terms of Use.