OPEN-SOURCE SCRIPT
Elder AutoEnvelope with Overbought/Oversold Levels with Labels
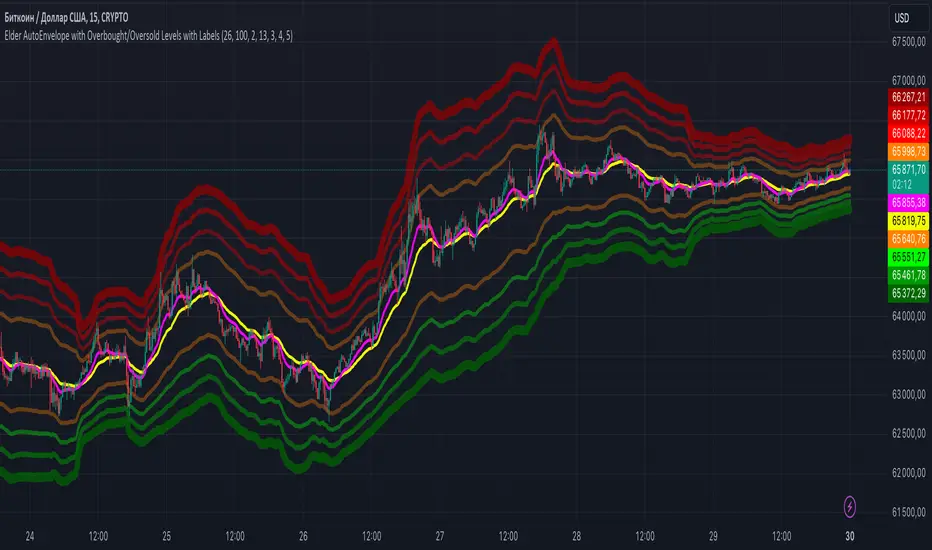
The **"Elder AutoEnvelope with Overbought/Oversold Levels with Labels"** is a technical analysis tool designed to help identify overbought and oversold levels in the market, as well as potential reversal points. It uses moving averages and price volatility to detect possible price extremes.
### Indicator Description:
- **Center EMA (26)**: Acts as the main trend line.
- **Envelope Channels**: These are constructed around the central EMA using the current price volatility. The main channel lines are determined by multiplying the standard deviation of the price by the chosen multiplier.
- **Additional Overbought/Oversold Levels**: Displayed on the chart with different colors and thicknesses to highlight small, moderate, strong, and very strong levels.
- **Labels**: Show specific levels when the price reaches areas of overbought or oversold conditions.
### How to Apply in Practice:
1. **Identifying Extremes**: The indicator shows areas where the price is considered overbought or oversold relative to the current trend. When the price touches or exceeds these levels, it can indicate a potential reversal or correction.
2. **Entry/Exit Signals**:
- **Entry on Oversold**: If the price reaches the lower Envelope lines (especially at strong or very strong oversold levels), it may be a good buying signal.
- **Exit on Overbought**: If the price touches the upper lines (especially at strong or very strong overbought levels), it signals a potential selling opportunity.
3. **Combining with Other Indicators**: It’s recommended to use this indicator alongside oscillators like RSI or MACD for signal confirmation.
4. **Trend Analysis**: The central EMA (26) helps identify the trend direction. If the price is above it, the trend is considered bullish; if below, bearish.
This indicator is particularly useful in volatile markets and helps detect price movements near highs or lows.
Open-source script
In true TradingView spirit, the creator of this script has made it open-source, so that traders can review and verify its functionality. Kudos to the author! While you can use it for free, remember that republishing the code is subject to our House Rules.
Disclaimer
The information and publications are not meant to be, and do not constitute, financial, investment, trading, or other types of advice or recommendations supplied or endorsed by TradingView. Read more in the Terms of Use.