OPEN-SOURCE SCRIPT
Updated Manipulation Day [Alex Ko]
🇺🇸 Description
Indicator “Manipulation Day”
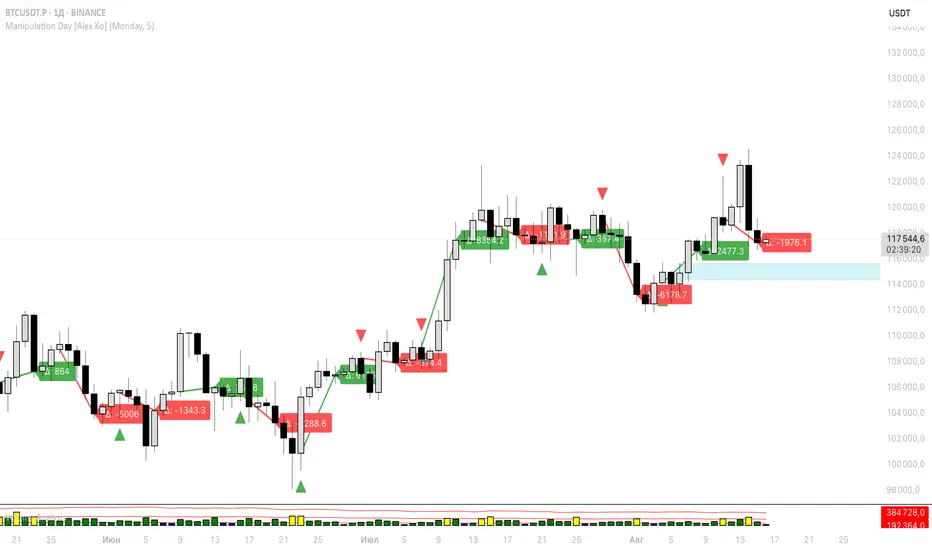
This indicator helps you detect a potential manipulation day (e.g. Monday) and track the price reaction afterward.
📌 Features:
Select any weekday as a manipulation day.
Wait for N candles after it.
If the manipulation day closes higher than it opened — a green triangle appears. If lower — red triangle.
After N days, a line is drawn from the next day's open to the close — green if price increased, red if dropped.
A label shows the delta (Δ) between open and close for that range.
🧠 Useful for spotting potential trap setups or liquidity grabs followed by directional moves.
Indicator “Manipulation Day”
This indicator helps you detect a potential manipulation day (e.g. Monday) and track the price reaction afterward.
📌 Features:
Select any weekday as a manipulation day.
Wait for N candles after it.
If the manipulation day closes higher than it opened — a green triangle appears. If lower — red triangle.
After N days, a line is drawn from the next day's open to the close — green if price increased, red if dropped.
A label shows the delta (Δ) between open and close for that range.
🧠 Useful for spotting potential trap setups or liquidity grabs followed by directional moves.
Release Notes
This indicator helps you detect a potential manipulation day (e.g. Monday) and track the price reaction afterward.📌 Features:
Select any weekday as a manipulation day.
Wait for N candles after it.
If the manipulation day closes higher than it opened — a green triangle appears. If lower — red triangle.
After N days, a line is drawn from the next day's open to the close — green if price increased, red if dropped.
A label shows the delta (Δ) between open and close for that range.
🧠 Useful for spotting potential trap setups or liquidity grabs followed by directional moves.
Release Notes
upd vsaOpen-source script
In true TradingView spirit, the creator of this script has made it open-source, so that traders can review and verify its functionality. Kudos to the author! While you can use it for free, remember that republishing the code is subject to our House Rules.
Disclaimer
The information and publications are not meant to be, and do not constitute, financial, investment, trading, or other types of advice or recommendations supplied or endorsed by TradingView. Read more in the Terms of Use.
Open-source script
In true TradingView spirit, the creator of this script has made it open-source, so that traders can review and verify its functionality. Kudos to the author! While you can use it for free, remember that republishing the code is subject to our House Rules.
Disclaimer
The information and publications are not meant to be, and do not constitute, financial, investment, trading, or other types of advice or recommendations supplied or endorsed by TradingView. Read more in the Terms of Use.