PROTECTED SOURCE SCRIPT
Scalperstool v1.0_Ramesh0296
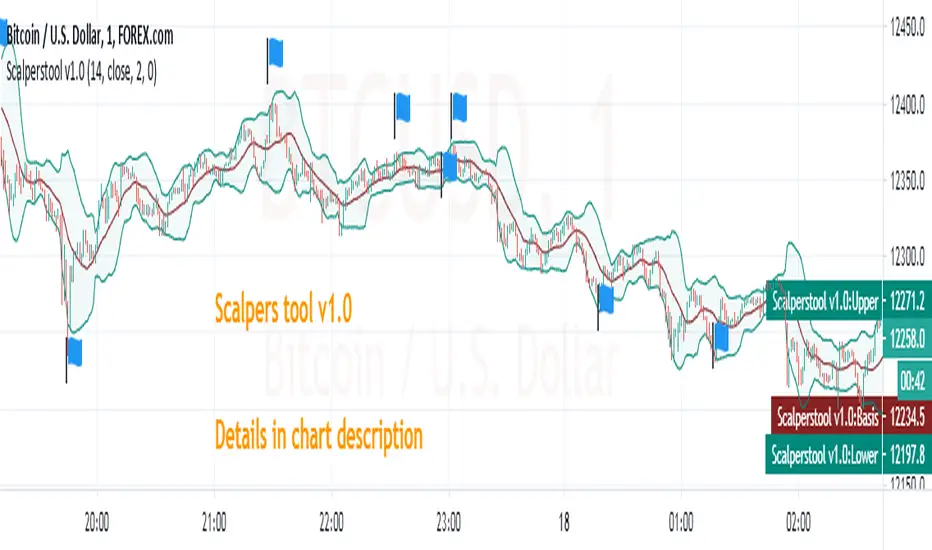
Scalperstool v1.0
This indicator can use for scalp in Highly liquid stocks,indices and currencies
What here i used ?
Here i used Bollinger bands with Modified Relative Strength Index (n=2)
How to use it ?
Apply scalperstool v1.0 in chart
Time frame 1min
once you applied 3 lines will plotted on chart but the value dimensions shows 4 value in top left side on the chart
first 3 values related to bollinger bands(here i used it for dynamic support and resistance). the last value shows modified RSI value
CONDITIONS
CONDITION 1
1 min candle should close and it must showing below value
safe Players
Buy condition (too safe) : RSI value should be less than or equal to 3
Sell condition (too safe) : RSI value should be greater than or equal to 97
Moderate Risk takers
Buy condition : RSI value should be less than or equal to 10
Sell condition : RSI value should be greater than or equal to 90
Most of the time the value above mentioned equals to bollinger upper band(overbought) and lower band(oversold) zones
CONDITION 2
May scalp alone with 1st condition but my favorite is i combined above condition with this one
This is too simple that 1 min candle should close with long upper wick or long lower wick & mostly its open equals to high looks like a hammer but not exact one.
I flag some good trades in chart.
STOP LOSS SHOULD BE ENTRY CANDLE'S PREVIOUS ONE LOW OR HIGH.
--------------------------------------------------------------------------------------------------------------------------
LIKE & FOLLOW TO SHOW YOUR LOVE & SUPPORT AND ALSO TO GET MORE TRADE IDEAS AND SCRIPTS
**Educational Purpose only
Protected script
This script is published as closed-source. However, you can use it freely and without any limitations – learn more here.
Disclaimer
The information and publications are not meant to be, and do not constitute, financial, investment, trading, or other types of advice or recommendations supplied or endorsed by TradingView. Read more in the Terms of Use.