Bears VS Bulls
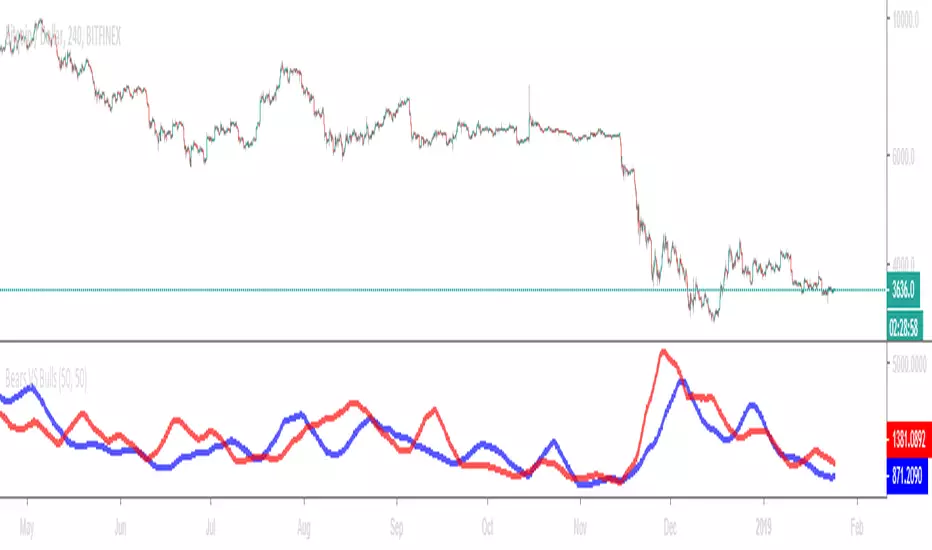
The red line is a moving average of ONLY sellers in the market.
The blue line is a moving average of ONLY buyers in the market.
The period or "length" of the individual moving averages can be adjusted in the indicator settings.
The default, it is set to 50.
Buying and selling trends often provide indications of market moves such as the most recent bottom in Cryptocurrencies.

Feel free to comment and share any indicator concepts or ideas for content you would like to see added to the Technical Indicator Bundle on kenzing.com
More to come.
Invite-only script
Only users approved by the author can access this script. You'll need to request and get permission to use it. This is typically granted after payment. For more details, follow the author's instructions below or contact GrantPeace directly.
TradingView does NOT recommend paying for or using a script unless you fully trust its author and understand how it works. You may also find free, open-source alternatives in our community scripts.
Author's instructions
kenzing.com
Disclaimer
Invite-only script
Only users approved by the author can access this script. You'll need to request and get permission to use it. This is typically granted after payment. For more details, follow the author's instructions below or contact GrantPeace directly.
TradingView does NOT recommend paying for or using a script unless you fully trust its author and understand how it works. You may also find free, open-source alternatives in our community scripts.
Author's instructions
kenzing.com