OPEN-SOURCE SCRIPT
Updated Market Info Bar Charts - Was Bored
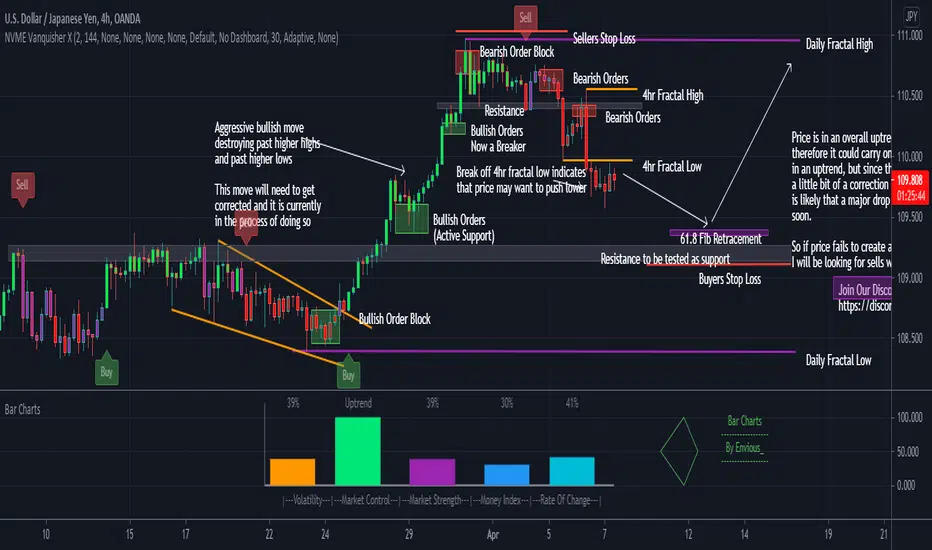
Simple script in a form of a bar chart showing you some market information ;)
Release Notes
Added Information:Volatility is calculated using the relative volatility index
Market Control is calculated using exponential moving averages and the percent of the strength is based on how many bars the market goes on in that trend.
Market Strength is calculated with RSI and will change colour if it is overbought (red) or oversold (green)
Money Index is calculated with Money Flow Index
Rate of Change is calculated with ROC but it cannot go to a negative number and the max it can go up to is a 100%.
You can change anything in this market info bar chart indicator if you need :)
Release Notes
Changed the font-size so that it suits the bar charts on different time-frames (still isn't fully accurate due to the limitation of font-sizes on pinescript)Open-source script
In true TradingView spirit, the creator of this script has made it open-source, so that traders can review and verify its functionality. Kudos to the author! While you can use it for free, remember that republishing the code is subject to our House Rules.
Disclaimer
The information and publications are not meant to be, and do not constitute, financial, investment, trading, or other types of advice or recommendations supplied or endorsed by TradingView. Read more in the Terms of Use.
Open-source script
In true TradingView spirit, the creator of this script has made it open-source, so that traders can review and verify its functionality. Kudos to the author! While you can use it for free, remember that republishing the code is subject to our House Rules.
Disclaimer
The information and publications are not meant to be, and do not constitute, financial, investment, trading, or other types of advice or recommendations supplied or endorsed by TradingView. Read more in the Terms of Use.