OPEN-SOURCE SCRIPT
Updated ATR Pivot Point Index [racer8]

Description:
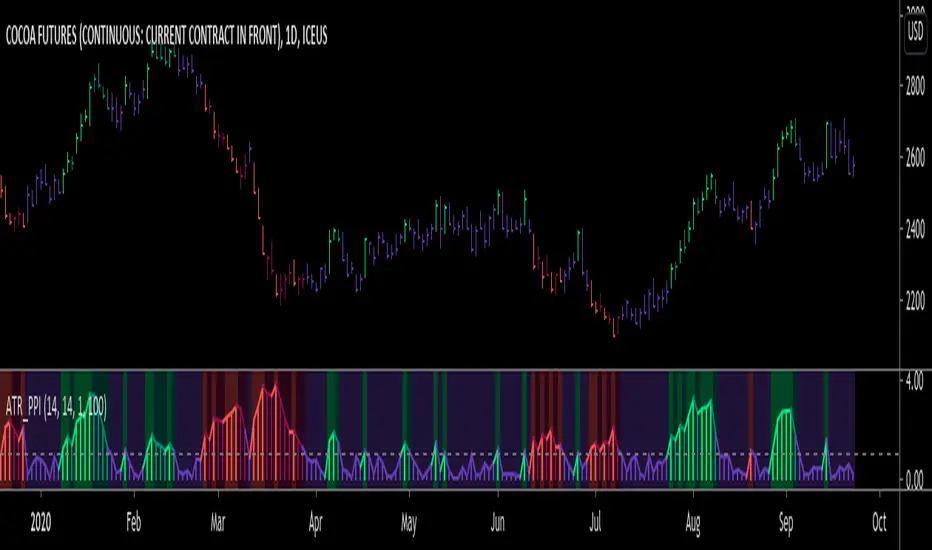
ATR Pivot Point Index (ATR_PPI) is based on the theory of mean reversion.
I was inspired to create this indicator after watching a particular YouTube video on the UKspreadbetting channel.
In this video, the trader being interviewed mentioned that he would exit when price is too far from the moving average.
In other words, he exits when he thinks price will revert back to the moving average (mean reversion).
I'm not sure what period moving average he used, so I set it to the standard 14 periods.
I wanted to quantify his strategy so that the user can consistently exit a trade at a fixed distance away from the moving average.
For this indicator, this distance is in ATR units.
This strategy of exiting is known as the mean reversion exit strategy.
Alternatively, if the user wishes to, this indicator can also be used as an entry indicator (Trend entry strategy).
---------------------------------------------------------------------------------------------------------------------------------------------------------------------------------
Parameters:
1. Sma Period - controls length of moving average (Affects histogram).
2. Atr Period - controls length of Atr, doesn't have much affect on indicator (Affects histogram).
3. Atr Pivot Point Level - controls horizontal line, it determines how far away in Atr units you want to exit/enter from the sma for every trade.
---------------------------------------------------------------------------------------------------------------------------------------------------------------------------------
Interpreting signals:
(Trend entry strategy) When histogram is...
Green - enter long
Red - enter short
Purple - No signal
(Mean reversion exit strategy) When histogram is...
Green - exit long
Red - exit short
Purple - No signal
---------------------------------------------------------------------------------------------------------------------------------------------------------------------------------
Calculation:
Distance = Absolute value of (current close - moving average(14))
ATR_units = Distance / ATR(14) ...........Plot as histogram.
Add horizontal line set at (2)*ATR .......Plot line.
Is histogram > line?
Yes, histogram color is green/red.
No, histogram color is purple.
Note: For mean reversion exit strategy, I recommend HIGHER Atr Pivot Point Level values. Vice versa for trend entry strategy.
Enjoy :)
Release Notes
Minor fix of code.Release Notes
...Changed ATR Pivot Point Level to a default value of 1 instead of 2.
Changed consolidation color from purple to gray :D
Release Notes
>>>- Changed consolidation color to indigo. Indigo is a rich color between blue and violet on the visible spectrum, it's a dark purplish blue.
- "ATR pivot point level" is now called "ATR level".
Release Notes
>>>Added a simple moving average for the histogram.
Release Notes
>>>Added option to show baseline (moving avg of histogram).
Release Notes
Added bar colors.Release Notes
All values are now to 2 decimal places.Open-source script
In true TradingView spirit, the creator of this script has made it open-source, so that traders can review and verify its functionality. Kudos to the author! While you can use it for free, remember that republishing the code is subject to our House Rules.
Disclaimer
The information and publications are not meant to be, and do not constitute, financial, investment, trading, or other types of advice or recommendations supplied or endorsed by TradingView. Read more in the Terms of Use.
Open-source script
In true TradingView spirit, the creator of this script has made it open-source, so that traders can review and verify its functionality. Kudos to the author! While you can use it for free, remember that republishing the code is subject to our House Rules.
Disclaimer
The information and publications are not meant to be, and do not constitute, financial, investment, trading, or other types of advice or recommendations supplied or endorsed by TradingView. Read more in the Terms of Use.