PROTECTED SOURCE SCRIPT
Green to Red Money Rails by FlyingOceanTiger
Buy at green. Sell at red. Let the rails do the drawing.
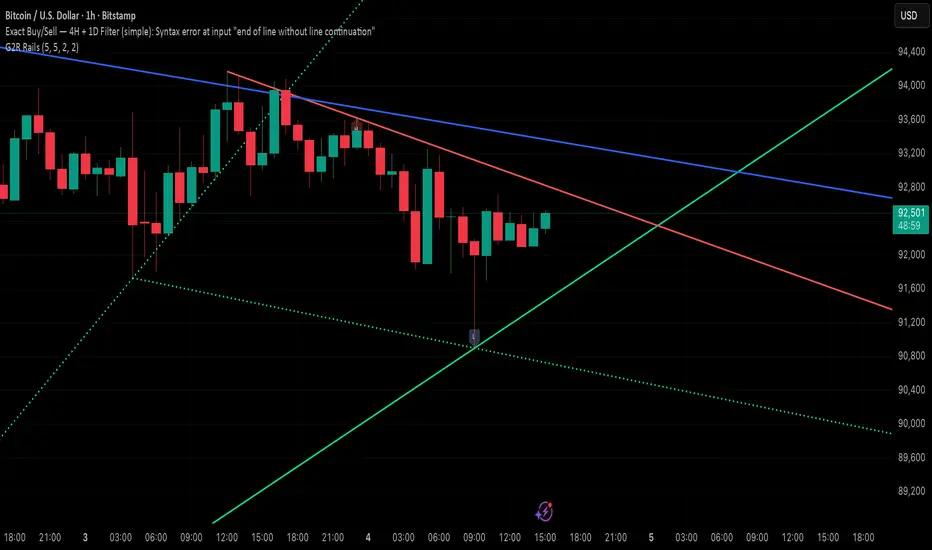
Green to Red Money Rails automatically draws rising green “money rails” from recent swing lows and a falling red resistance rail from recent swing highs.
Instead of manually hunting for trendlines on every chart and timeframe, this indicator finds the last three swing lows and last two swing highs and builds a clean fan of support plus one key resistance line for you.
How it works
• Uses pivot lows to build up-sloping green support fans (inner dotted rails + one solid base rail).
• Uses pivot highs to build a single down-sloping red resistance rail.
• Lines are time-anchored so they stay glued to price when you zoom or pan.
• Optional L / H labels show the latest swing low and swing high anchors.
Typical use case
• Trade a simple idea: “Buy near green support, take profit or fade at red resistance, avoid chasing breakouts.”
• Quickly map structure on any asset (crypto, stocks, forex) and any timeframe without redrawing trendlines.
Inputs & customization
• Pivot length for lows & highs (controls how “swingy” the pivots are).
• Toggle inner fans vs main base rail.
• Toggle pivot labels.
• Custom colors & line widths for green and red rails.
Important disclaimer
This is not a buy/sell signal by itself. It’s a visual tool to speed up your trendline workflow. Always combine it with your own risk management and confirmation (price action, volume, higher-timeframe context, etc.). Nothing here is financial advice.
Protected script
This script is published as closed-source. However, you can use it freely and without any limitations – learn more here.
Disclaimer
The information and publications are not meant to be, and do not constitute, financial, investment, trading, or other types of advice or recommendations supplied or endorsed by TradingView. Read more in the Terms of Use.