OPEN-SOURCE SCRIPT
Updated MACD Area
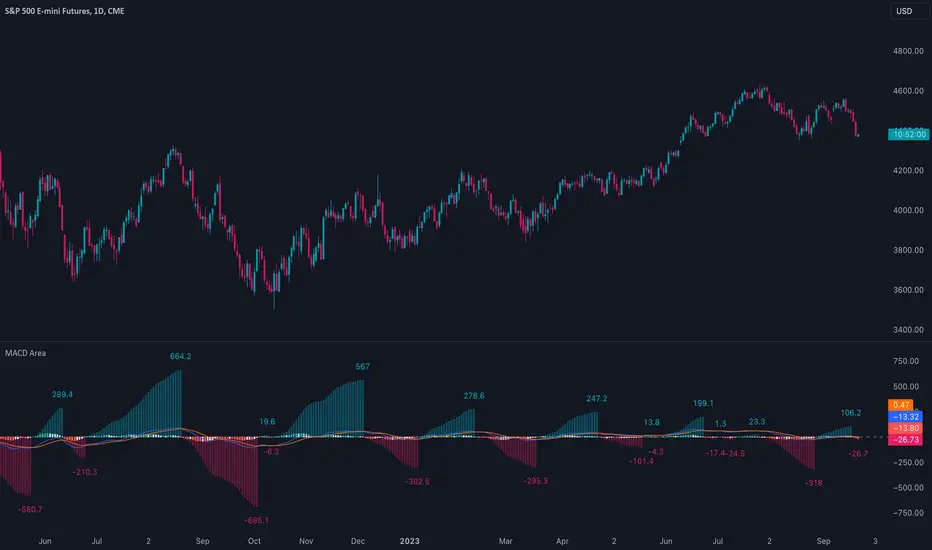
This indicator calculates and displays the cumulative area for each region above and below the zero line in the MACD histogram. This area measurement serves as a momentum metric, where larger cumulative areas indicate stronger momentum. Divergences between the area and price can also potentially indicate an impending reversal. For example, when the stock price makes a higher high but the area makes a lower high, the current momentum may be unsustainable.
Release Notes
Added support for displaying area values via labels.Open-source script
In true TradingView spirit, the creator of this script has made it open-source, so that traders can review and verify its functionality. Kudos to the author! While you can use it for free, remember that republishing the code is subject to our House Rules.
专业缠论指标: alphaviz.pro/chanlun
Email: contact@alphaviz.pro
Discord: discord.gg/w2fFtNega4
Email: contact@alphaviz.pro
Discord: discord.gg/w2fFtNega4
Disclaimer
The information and publications are not meant to be, and do not constitute, financial, investment, trading, or other types of advice or recommendations supplied or endorsed by TradingView. Read more in the Terms of Use.
Open-source script
In true TradingView spirit, the creator of this script has made it open-source, so that traders can review and verify its functionality. Kudos to the author! While you can use it for free, remember that republishing the code is subject to our House Rules.
专业缠论指标: alphaviz.pro/chanlun
Email: contact@alphaviz.pro
Discord: discord.gg/w2fFtNega4
Email: contact@alphaviz.pro
Discord: discord.gg/w2fFtNega4
Disclaimer
The information and publications are not meant to be, and do not constitute, financial, investment, trading, or other types of advice or recommendations supplied or endorsed by TradingView. Read more in the Terms of Use.