OPEN-SOURCE SCRIPT
Serajian Oscillator
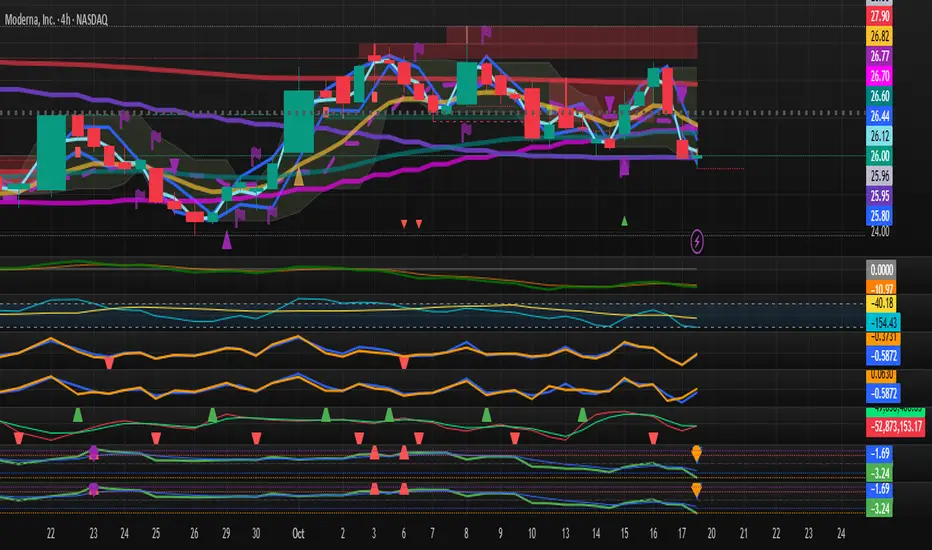
Unleash the power of momentum with the Serajian Oscillator! This innovative indicator tracks the normalized difference between price and volume Rate of Change (ROC), delivering a vibrant oscillator with a 5-period EMA for visual guidance. Spot high-probability reversals with striking markers at the chart’s bottom: red triangles signal overbought conditions (> +2.0), blue triangles highlight oversold zones (< -2.0), purple diamonds flag extreme overbought levels (> +3.0), and orange diamonds pinpoint extreme oversold opportunities (< -3.0). Stay ahead with instant alerts on zone entries! Perfect for traders hunting reversals in stocks, forex, or crypto, the Serajian Oscillator lets you fine-tune ROC Period, Normalization Period, and zone thresholds to match your strategy.
**Important**: Like all indicators, the Serajian Oscillator can generate false signals and should not be used alone. Always combine it with other technical analysis tools, price action, or market context for confirmation. This indicator is provided for informational purposes only. Traders are solely responsible for thoroughly backtesting and validating its performance before use. The author is not responsible for any financial losses or decisions made based on this indicator. Use at your own risk and dive into the action wisely!
**Important**: Like all indicators, the Serajian Oscillator can generate false signals and should not be used alone. Always combine it with other technical analysis tools, price action, or market context for confirmation. This indicator is provided for informational purposes only. Traders are solely responsible for thoroughly backtesting and validating its performance before use. The author is not responsible for any financial losses or decisions made based on this indicator. Use at your own risk and dive into the action wisely!
Open-source script
In true TradingView spirit, the creator of this script has made it open-source, so that traders can review and verify its functionality. Kudos to the author! While you can use it for free, remember that republishing the code is subject to our House Rules.
Disclaimer
The information and publications are not meant to be, and do not constitute, financial, investment, trading, or other types of advice or recommendations supplied or endorsed by TradingView. Read more in the Terms of Use.