OPEN-SOURCE SCRIPT
SuperRange - evo
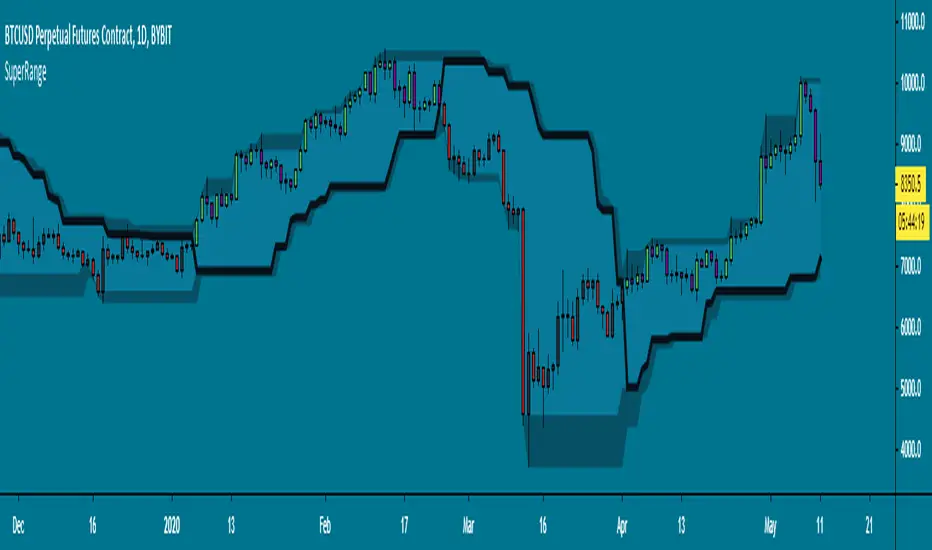
A SuperTrend like indicator based on highest and lowest candle close from a few bars back. It looks almost the same as Donchian Channels but with a dominant trend direction inside (Black line).
Uptrend: Candle closed higher than highest close
Downtrend: Candle closed lower than lowest close
This works best on higher time frames since a daily close is more powerful than a 15 minute close.
A few examples how you could use this:
Use support & resistance

Apply a moving average

Buy and sell the break-out

All perfect world examples, this does not happen all the time off course.. Its just for the idea. There are many ways to trade this so feel free to share in the comments, good luck and follow the trend! :)
Uptrend: Candle closed higher than highest close
Downtrend: Candle closed lower than lowest close
This works best on higher time frames since a daily close is more powerful than a 15 minute close.
A few examples how you could use this:
Use support & resistance
Apply a moving average
Buy and sell the break-out
All perfect world examples, this does not happen all the time off course.. Its just for the idea. There are many ways to trade this so feel free to share in the comments, good luck and follow the trend! :)
Open-source script
In true TradingView spirit, the creator of this script has made it open-source, so that traders can review and verify its functionality. Kudos to the author! While you can use it for free, remember that republishing the code is subject to our House Rules.
Disclaimer
The information and publications are not meant to be, and do not constitute, financial, investment, trading, or other types of advice or recommendations supplied or endorsed by TradingView. Read more in the Terms of Use.