OPEN-SOURCE SCRIPT
VWAP oscillator [upslidedown]
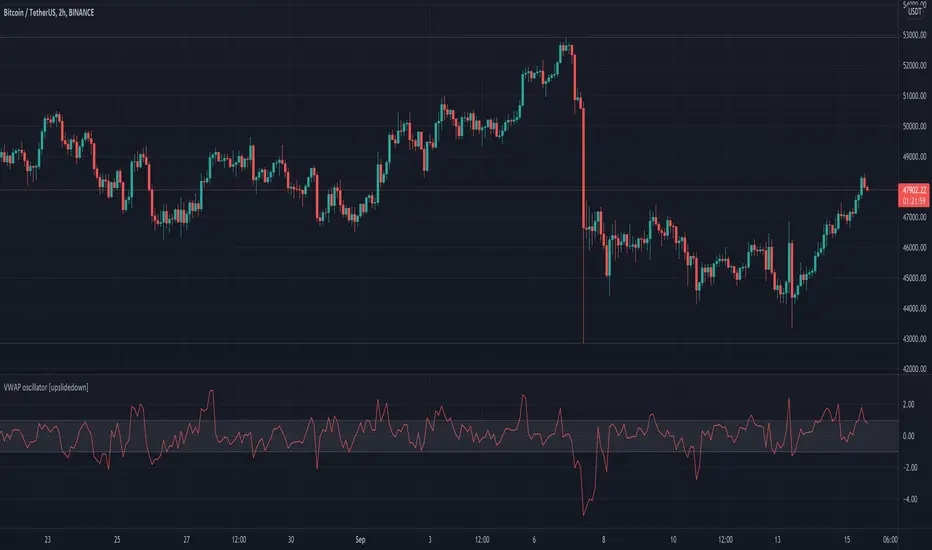
This VWAP oscillator showcases the percent difference between VWAP and current price within an oscillator centered on 0. My thesis for this indicator is that trend following within the threshold zone (defaulted to 1%) would be "choppy" but outside is a significant trend. Another way to think about VWAP is potential for taking profits, as price will always be magnetized back to the center.
I find this sort of visualization very helpful when creating strategies that revolve around a filter such as VWAP and wasn't able to find anything that was close and/or provided this sort of visualization publicly. Enjoy and let me know if you find this useful or can dream up an improvement.
I find this sort of visualization very helpful when creating strategies that revolve around a filter such as VWAP and wasn't able to find anything that was close and/or provided this sort of visualization publicly. Enjoy and let me know if you find this useful or can dream up an improvement.
Open-source script
In true TradingView spirit, the creator of this script has made it open-source, so that traders can review and verify its functionality. Kudos to the author! While you can use it for free, remember that republishing the code is subject to our House Rules.
❤️ Premium indicator subscription @ Whop includes: Mojo Levels, Manipulation Model, Super Oscillator, VIX Meter, and Volatility Radar
🔗 whop.com/c/upslidedown/t use discount code FRIENDOFUSD for 20% off FOREVER
🔗 whop.com/c/upslidedown/t use discount code FRIENDOFUSD for 20% off FOREVER
Disclaimer
The information and publications are not meant to be, and do not constitute, financial, investment, trading, or other types of advice or recommendations supplied or endorsed by TradingView. Read more in the Terms of Use.