OPEN-SOURCE SCRIPT
Market Cycles
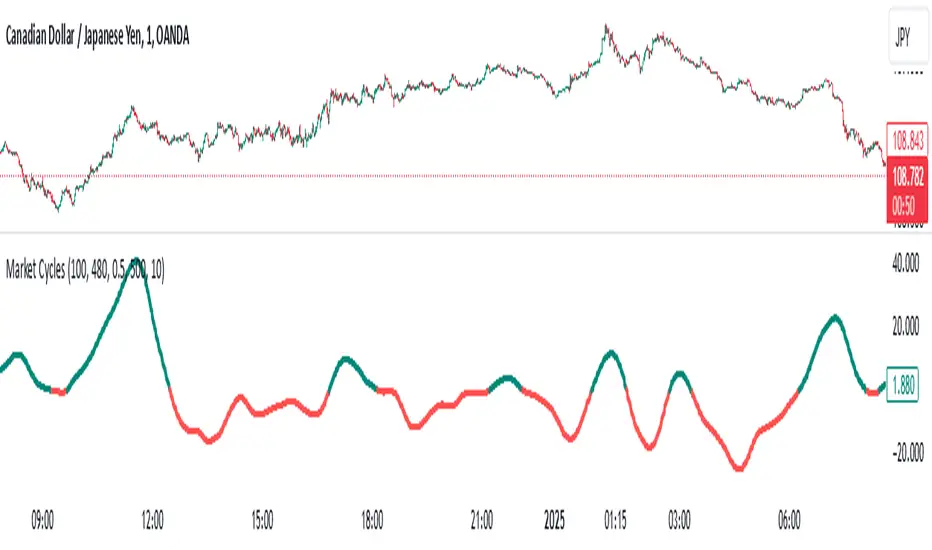
The Market Cycles indicator transforms market price data into a stochastic wave, offering a unique perspective on market cycles. The wave is bounded between positive and negative values, providing clear visual cues for potential bullish and bearish trends. When the wave turns green, it signals a bullish cycle, while red indicates a bearish cycle.
Designed to show clarity and precision, this tool helps identify market momentum and cyclical behavior in an intuitive way. Ideal for fine-tuning entries or analyzing broader trends, this indicator aims to enhance the decision-making process with simplicity and elegance.
Open-source script
In true TradingView spirit, the creator of this script has made it open-source, so that traders can review and verify its functionality. Kudos to the author! While you can use it for free, remember that republishing the code is subject to our House Rules.
Disclaimer
The information and publications are not meant to be, and do not constitute, financial, investment, trading, or other types of advice or recommendations supplied or endorsed by TradingView. Read more in the Terms of Use.