OPEN-SOURCE SCRIPT
ROC & Momentum Fusion
ROC & Momentum Fusion
(by HabibiTrades ©)
Purpose:
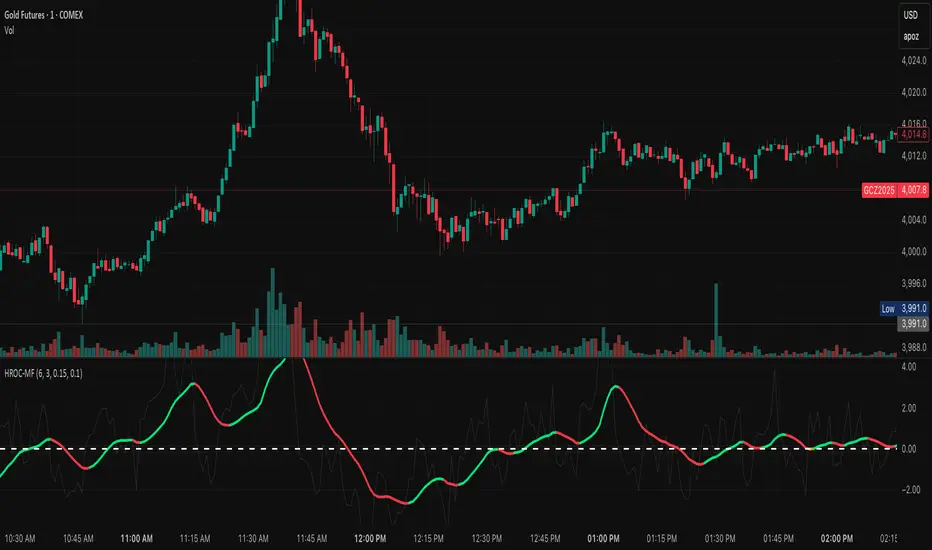
“ROC & Momentum Fusion” combines the Rate of Change (ROC) with a MACD-style signal engine to identify early momentum reversals, confirmed trend shifts, and low-volatility choppy zones.
It’s built for traders who want early momentum detection with the clarity of trend persistence — adaptable to any instrument and timeframe.
⚙️ How It Works
Rate of Change (ROC):
Measures the percentage speed of price change over time, showing the raw momentum strength.
Signal Line (EMA):
A short EMA of the ROC — responds faster to new directional shifts, similar to a MACD signal line.
Histogram:
Displays acceleration and deceleration between the ROC and its signal line.
Persistent Trend States:
When the ROC crosses the signal line or zero, the indicator enters a new momentum regime
(bullish or bearish) and stays in that color until another flip occurs.
Dynamic Choppy Zone:
When ROC momentum fades within the zero buffer zone, the indicator turns orange, signaling a sideways or indecisive market.
🟢 Visual Regimes
Regime Description Color
Bullish Momentum ROC above zero or signal line 🟢 Neon Green
Bearish Momentum ROC below zero or signal line 🔴 Neon Red
Choppy / Neutral ROC hovering within ±threshold range 🟠 Neon Orange
This color system makes it visually effortless to see whether the market is trending, reversing, or consolidating.
🧭 Adaptive Intelligence
The script automatically adjusts to market type and session for consistent accuracy:
Session Adaptive: Adjusts smoothing based on global sessions (Asian, London, New York, Sydney).
Instrument Adaptive: Fine-tunes sensitivity automatically for major assets — NASDAQ (NQ), S&P 500 (ES), Gold (GC), Oil (CL), Bitcoin (BTC).
Volatility Normalization: Optionally divides ROC by its own standard deviation to stabilize noisy assets and maintain consistent scaling.
🔔 Signals & Alerts
Bullish Reversal:
ROC crosses above its signal or zero line — early momentum flip.
Bearish Reversal:
ROC crosses below its signal or zero line — downward momentum flip.
Alerts:
Both reversal conditions include built-in alert triggers for automation and notifications.
🎨 Visual Features
Main ROC Line: Adaptive EMA of ROC, color-coded by trend regime.
Signal Line: Optional white EMA overlay for MACD-style crossovers.
Histogram: Visual burst display of acceleration (green/red).
Reversal Markers: Optional triangles marking exact crossover points.
Threshold Lines: Highlight the zero and buffer zones for visual clarity.
🧩 Best Use Cases
Identify early momentum shifts before price confirms them.
Confirm trend continuation or exhaustion with color persistence.
Detect choppy / low-volatility periods instantly.
Works across all timeframes — from 1-minute scalping to weekly swings.
Combine with structure, EMAs, or volume for confirmation.
⚙️ Recommended Settings
Setting Default Description
ROC Period 6 Core momentum length (lower = faster response).
Signal EMA Length 3 MACD-style responsiveness (lower = more reactive).
Zero Buffer Threshold 0.15 Defines the width of the neutral zone around zero.
Choppy Zone Multiplier 1.0 Expands or tightens the orange zone sensitivity.
These defaults have been optimized through real-market testing to balance responsiveness and smoothness across different asset classes.
⚠️ Notes
The color regime is persistent, meaning once the line turns bullish or bearish, it remains in that state until momentum structurally flips.
The orange zone represents momentum uncertainty and helps avoid false entries in range-bound markets.
Works seamlessly on any timeframe and with any asset.
(by HabibiTrades ©)
Purpose:
“ROC & Momentum Fusion” combines the Rate of Change (ROC) with a MACD-style signal engine to identify early momentum reversals, confirmed trend shifts, and low-volatility choppy zones.
It’s built for traders who want early momentum detection with the clarity of trend persistence — adaptable to any instrument and timeframe.
⚙️ How It Works
Rate of Change (ROC):
Measures the percentage speed of price change over time, showing the raw momentum strength.
Signal Line (EMA):
A short EMA of the ROC — responds faster to new directional shifts, similar to a MACD signal line.
Histogram:
Displays acceleration and deceleration between the ROC and its signal line.
Persistent Trend States:
When the ROC crosses the signal line or zero, the indicator enters a new momentum regime
(bullish or bearish) and stays in that color until another flip occurs.
Dynamic Choppy Zone:
When ROC momentum fades within the zero buffer zone, the indicator turns orange, signaling a sideways or indecisive market.
🟢 Visual Regimes
Regime Description Color
Bullish Momentum ROC above zero or signal line 🟢 Neon Green
Bearish Momentum ROC below zero or signal line 🔴 Neon Red
Choppy / Neutral ROC hovering within ±threshold range 🟠 Neon Orange
This color system makes it visually effortless to see whether the market is trending, reversing, or consolidating.
🧭 Adaptive Intelligence
The script automatically adjusts to market type and session for consistent accuracy:
Session Adaptive: Adjusts smoothing based on global sessions (Asian, London, New York, Sydney).
Instrument Adaptive: Fine-tunes sensitivity automatically for major assets — NASDAQ (NQ), S&P 500 (ES), Gold (GC), Oil (CL), Bitcoin (BTC).
Volatility Normalization: Optionally divides ROC by its own standard deviation to stabilize noisy assets and maintain consistent scaling.
🔔 Signals & Alerts
Bullish Reversal:
ROC crosses above its signal or zero line — early momentum flip.
Bearish Reversal:
ROC crosses below its signal or zero line — downward momentum flip.
Alerts:
Both reversal conditions include built-in alert triggers for automation and notifications.
🎨 Visual Features
Main ROC Line: Adaptive EMA of ROC, color-coded by trend regime.
Signal Line: Optional white EMA overlay for MACD-style crossovers.
Histogram: Visual burst display of acceleration (green/red).
Reversal Markers: Optional triangles marking exact crossover points.
Threshold Lines: Highlight the zero and buffer zones for visual clarity.
🧩 Best Use Cases
Identify early momentum shifts before price confirms them.
Confirm trend continuation or exhaustion with color persistence.
Detect choppy / low-volatility periods instantly.
Works across all timeframes — from 1-minute scalping to weekly swings.
Combine with structure, EMAs, or volume for confirmation.
⚙️ Recommended Settings
Setting Default Description
ROC Period 6 Core momentum length (lower = faster response).
Signal EMA Length 3 MACD-style responsiveness (lower = more reactive).
Zero Buffer Threshold 0.15 Defines the width of the neutral zone around zero.
Choppy Zone Multiplier 1.0 Expands or tightens the orange zone sensitivity.
These defaults have been optimized through real-market testing to balance responsiveness and smoothness across different asset classes.
⚠️ Notes
The color regime is persistent, meaning once the line turns bullish or bearish, it remains in that state until momentum structurally flips.
The orange zone represents momentum uncertainty and helps avoid false entries in range-bound markets.
Works seamlessly on any timeframe and with any asset.
Open-source script
In true TradingView spirit, the creator of this script has made it open-source, so that traders can review and verify its functionality. Kudos to the author! While you can use it for free, remember that republishing the code is subject to our House Rules.
Disclaimer
The information and publications are not meant to be, and do not constitute, financial, investment, trading, or other types of advice or recommendations supplied or endorsed by TradingView. Read more in the Terms of Use.