OPEN-SOURCE SCRIPT
Updated Dashboard With Strength Trend & Phase Market
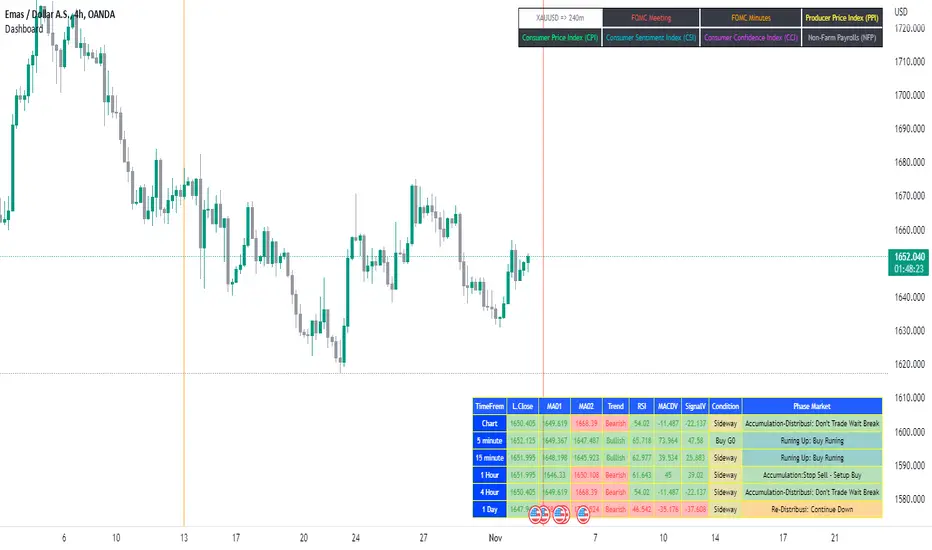
This is a multi timeframe (MTF) MACDV Dashboard and comes with additional features to show you whether there is currently a bullish or bearish cross for the EMA period you have selected in the settings menu, and identify the state of the market phase.
original Code : @KP_House & @JustInNovel
original Code : @KP_House & @JustInNovel
Release Notes
Fix : Size Dashboard ErrorAdd : added an economic calendar and colored lines as markers
Open-source script
In true TradingView spirit, the creator of this script has made it open-source, so that traders can review and verify its functionality. Kudos to the author! While you can use it for free, remember that republishing the code is subject to our House Rules.
Disclaimer
The information and publications are not meant to be, and do not constitute, financial, investment, trading, or other types of advice or recommendations supplied or endorsed by TradingView. Read more in the Terms of Use.