OPEN-SOURCE SCRIPT
VIX SPX & XJO
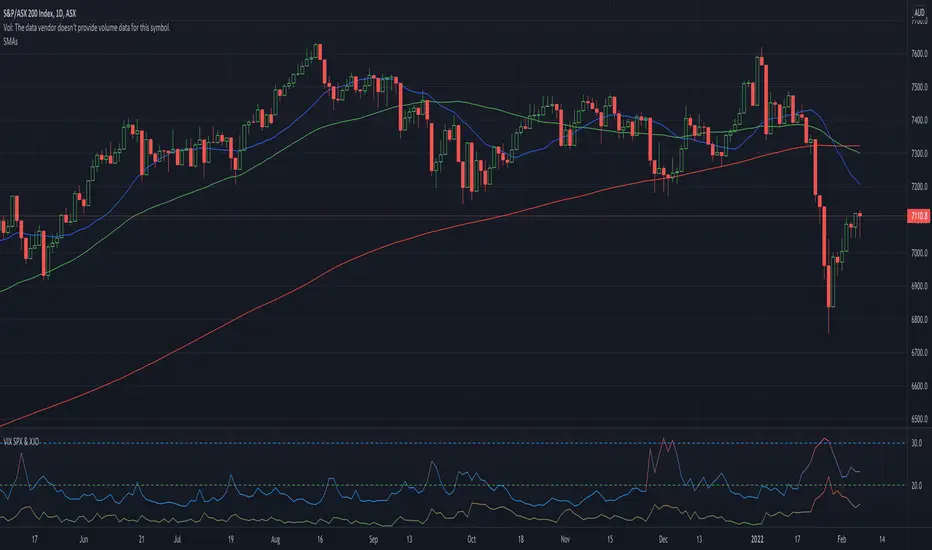
Vix is a volatility indicator that lets traders know when to be cautious.
This indicator shows the volatility for the US market as well as the Australian market on seperate lines.
Blue lines are Vix for SPX (S&P 500)
If blue indicator goes above 30, high volatility is present and caution should be taken.
Green lines are Vix for XJO (ASX 200)
If green indicator goes above 20, high volatility is present and caution should be taken.
Open-source script
In true TradingView spirit, the creator of this script has made it open-source, so that traders can review and verify its functionality. Kudos to the author! While you can use it for free, remember that republishing the code is subject to our House Rules.
Disclaimer
The information and publications are not meant to be, and do not constitute, financial, investment, trading, or other types of advice or recommendations supplied or endorsed by TradingView. Read more in the Terms of Use.