PROTECTED SOURCE SCRIPT
Trend Continuation — Compact HUD Pane
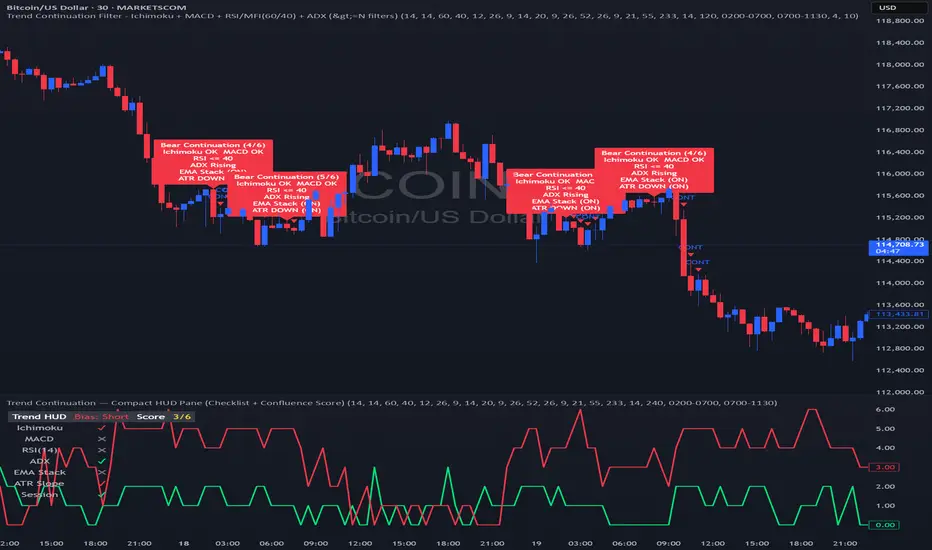
🖥️ Trend Continuation HUD Panel — Multi-Factor Dashboard
This panel is your trend continuation command center ⚡. Instead of guessing which filters are in play, the HUD shows you a real-time checklist of up to 6 confluence filters — with clear ✔ and ✖ signals.
🔍 What it shows
Each row = one filter. Green ✔ means it’s passing in the trend direction, red ✖ means it’s failing, grey ✖ means neutral/inactive.
✔ Ichimoku (9/26/52/26) → Above/Below cloud + Tenkan/Kijun order
✔ MACD (12/26/9) → Histogram slope & zero-line alignment
✔ RSI / MFI (14) → Momentum ≥60 bull / ≤40 bear
✔ ADX (14) → Strength ≥20 and rising
✔ EMA Alignment (9/21/55/233) (optional) → Stack order confirms trend engine
✔ ATR Slope (14) (optional) → Expanding volatility filter
📊 Score Line (0–6 scale)
At the bottom of the HUD you’ll see a colored score plot:
🟢 5–6 = A-Grade Trend Environment → strongest continuation regimes
🟡 3–4 = Mixed Bag → wait for clarity
🔴 0–2 = Fail Zone → stay flat, no trend support
🎯 How to use it
Scan the HUD first → wait until Score ≥5 and most rows are ✔ green.
Then check Overlay labels/arrows → only take signals while HUD is green (trend environment confirmed).
Adjust strictness with minChecks:
• Normal Days → Score ≥4 acceptable (partial TP style).
• Trend Days → Demand Score ≥5 (stacked, high-conviction runs).
🧩 Best Practices
⏰ Focus on London & NY sessions (HUD grays out off-hours).
🔄 Keep the HUD & Overlay in sync (same EMA/ATR/session settings).
⚡ Use the HUD as your filter, Overlay as your trigger → keeps you aligned with your trading plan and risk model.
Protected script
This script is published as closed-source. However, you can use it freely and without any limitations – learn more here.
Disclaimer
The information and publications are not meant to be, and do not constitute, financial, investment, trading, or other types of advice or recommendations supplied or endorsed by TradingView. Read more in the Terms of Use.