OPEN-SOURCE SCRIPT
Updated SATHYA SMA Signal)
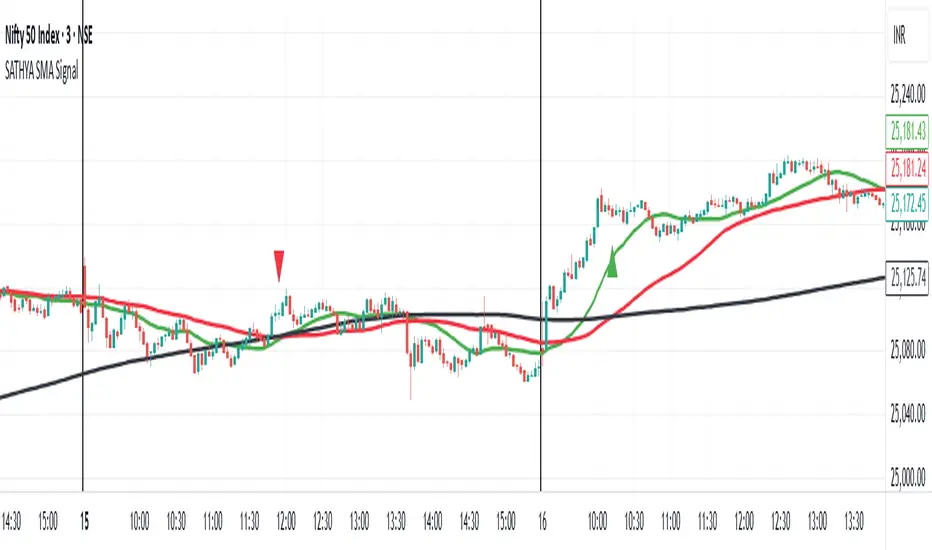
This indicator overlays 20, 50, and 200 Simple Moving Averages (SMAs) on the chart. It generates bullish signals when the 20 SMA crosses above the 200 SMA before the 50 SMA, with both above 200 SMA. Bearish signals occur when the 20 SMA crosses below the 200 SMA before the 50 SMA, with both below 200 SMA. Signals appear as distinct triangles on the chart, helping traders identify trend reversals based on systematic SMA crossovers and order of crossing.
Release Notes
This indicator overlays 20, 50, and 200 Simple Moving Averages (SMAs) on the chart. It generates bullish signals when the 20 SMA crosses above the 200 SMA before the 50 SMA, with both above 200 SMA. Bearish signals occur when the 20 SMA crosses below the 200 SMA before the 50 SMA, with both below 200 SMA. Signals appear as distinct triangles on the chart, helping traders identify trend reversals based on systematic SMA crossovers and order of crossing.Open-source script
In true TradingView spirit, the creator of this script has made it open-source, so that traders can review and verify its functionality. Kudos to the author! While you can use it for free, remember that republishing the code is subject to our House Rules.
Disclaimer
The information and publications are not meant to be, and do not constitute, financial, investment, trading, or other types of advice or recommendations supplied or endorsed by TradingView. Read more in the Terms of Use.
Open-source script
In true TradingView spirit, the creator of this script has made it open-source, so that traders can review and verify its functionality. Kudos to the author! While you can use it for free, remember that republishing the code is subject to our House Rules.
Disclaimer
The information and publications are not meant to be, and do not constitute, financial, investment, trading, or other types of advice or recommendations supplied or endorsed by TradingView. Read more in the Terms of Use.