OPEN-SOURCE SCRIPT
[KVA] KATR
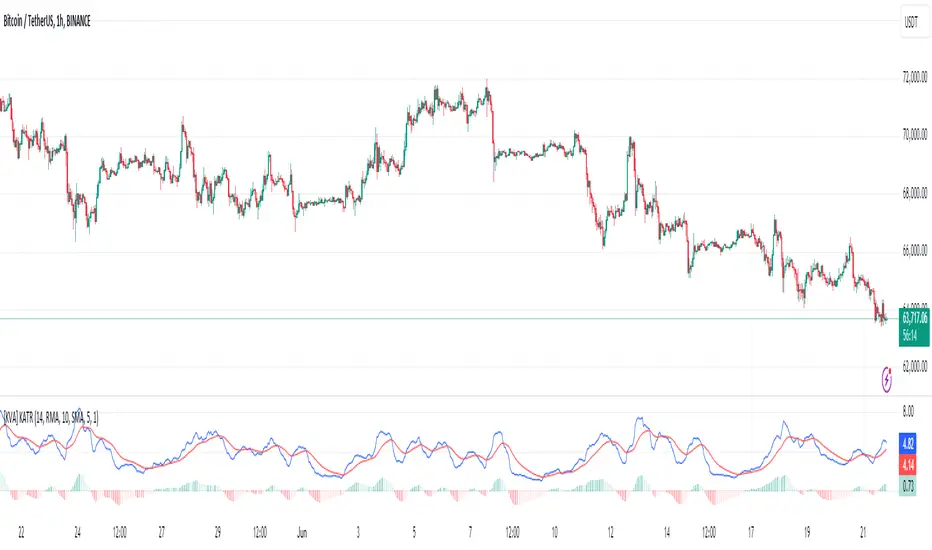
The [KVA] KATR indicator enhances the traditional ATR by leveraging the most common candle body percentage range, tailoring volatility measurement to specific market contexts. This advanced tool provides more relevant insights tailored to current market conditions.
Key Features:
Configurable ATR Length: Allows users to set the period for the ATR calculation, providing flexibility to adapt to different trading strategies and timeframes.
Multiple Smoothing Options: Offers a choice of RMA, SMA, EMA, and WMA for smoothing the ATR, enabling traders to select the method that best suits their analysis style.
Histogram Visualization for ATR Differences: The histogram visually represents the difference between the ATR and its moving average. This difference, or "dif," is calculated and smoothed, then multiplied by a user-defined factor. The histogram color indicates market conditions:
Light Red: Increasing but below zero, signaling potential weakening.
Light Green: Increasing and above zero, indicating strengthening.
Dark Green: Decreasing but above zero, showing potential weakening.
Dark Red: Decreasing and below zero, indicating strong weakening.
Ideal for Traders:
This indicator is perfect for traders seeking precise, context-sensitive volatility assessments to optimize trade timing and risk management strategies. Integrated seamlessly with other technical indicators, the KATR enhances your trading dashboard by adding depth to volatility analysis.
Detailed Explanation:
ATR Calculation: The ATR is derived by taking the average true range over a specified period, multiplied by the most common body percentage found in historical data.
Smoothing: Users can smooth the ATR using different methods, adding flexibility and customization to suit various trading styles.
Histogram: The histogram's primary function is to visualize the difference between the current ATR and its smoothed average. This provides clear, visual signals for potential volatility expansions or contractions, aiding in better decision-making.
Whether you're a day trader or a long-term investor, the KATR helps you stay ahead of market trends with reliable and easy-to-interpret insights. Elevate your trading strategy with the KATR's innovative approach to volatility measurement.
Open-source script
In true TradingView spirit, the creator of this script has made it open-source, so that traders can review and verify its functionality. Kudos to the author! While you can use it for free, remember that republishing the code is subject to our House Rules.
Disclaimer
The information and publications are not meant to be, and do not constitute, financial, investment, trading, or other types of advice or recommendations supplied or endorsed by TradingView. Read more in the Terms of Use.