PROTECTED SOURCE SCRIPT
ICT Kill-Zones / Sessions
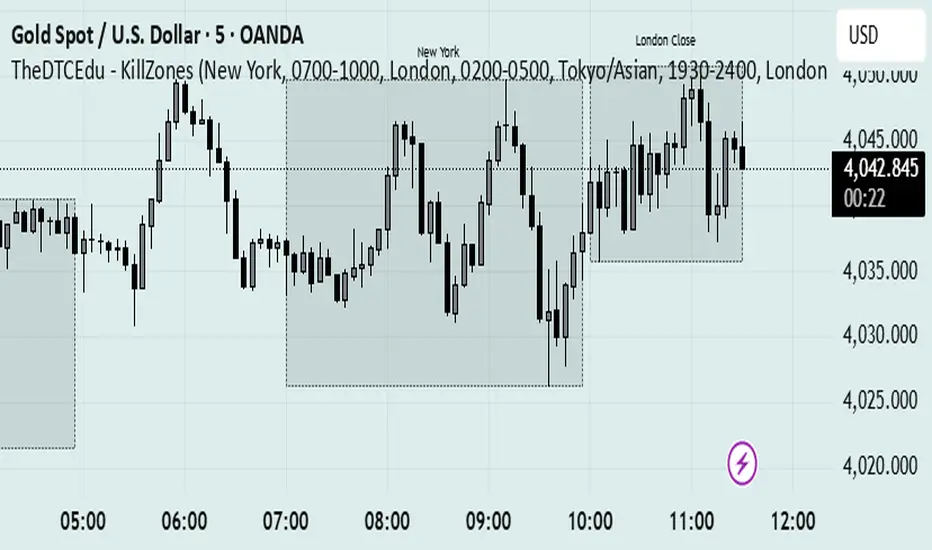
ICT Kill-Zones / Sessions — TheDTCEdu Edition
This indicator visually maps out ICT Killzones and key market sessions (New York, London, Tokyo/Asian, and London Close) directly on your chart — making it easy to identify high-probability trading windows and liquidity shifts.
Each session is displayed with a shaded range to help you quickly spot:
Time-based confluences between sessions
Intraday reversals and continuation zones
Market maker manipulation windows
Daily range structure and potential setups
🔹 Sessions Included:
New York (07:00–10:00)
London (02:00–05:00)
Tokyo/Asian (19:30–24:00)
London Close (10:00–12:00)
🔹 Features:
Adjustable sessions and colors
Optional range overlays and dividers
Daily separators with weekday labels
Clean, minimal design for ICT-style price action traders
⚙️ Important:
To ensure your killzones align correctly, set your chart timezone (bottom-right corner of the chart) to New York.
📈 Ideal for traders studying ICT concepts, time-based confluences, or session-volume correlations across FX, indices, or commodities.
Protected script
This script is published as closed-source. However, you can use it freely and without any limitations – learn more here.
📊Official TradingView acc. of The Day Trading Channel(DTC)
🎯Sharing premium trading strategies, insights, and tools
💡Focused on Forex, Gold, and Smart Money Concepts
🎥YouTube: @TheDayTradingChannelEdu
📢Telegram: t.me/theDayTradingChannel_updates
🎯Sharing premium trading strategies, insights, and tools
💡Focused on Forex, Gold, and Smart Money Concepts
🎥YouTube: @TheDayTradingChannelEdu
📢Telegram: t.me/theDayTradingChannel_updates
Disclaimer
The information and publications are not meant to be, and do not constitute, financial, investment, trading, or other types of advice or recommendations supplied or endorsed by TradingView. Read more in the Terms of Use.