OPEN-SOURCE SCRIPT
BTCUSD vs S&P500 (Daily)
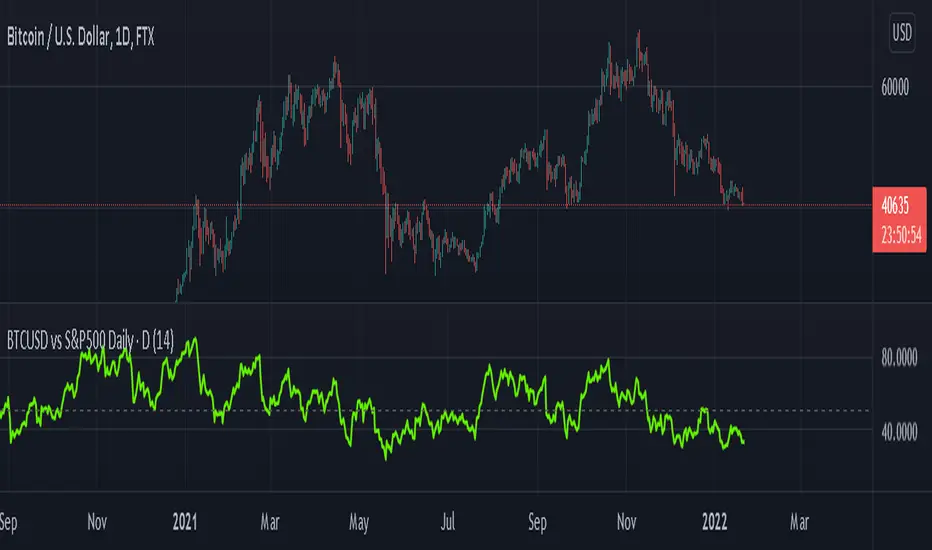
This script plots an RSI of the difference between the BTCUSD (FTX) and S&P 500 (FRED) prices, useful to see how the BTCUSD price correlates to the stock market.
This works in the daily timeframe only (because the S&P 500 can only be sampled on this timeframe). You can try lower timeframes but they will be gapped / interpolated.
This works in the daily timeframe only (because the S&P 500 can only be sampled on this timeframe). You can try lower timeframes but they will be gapped / interpolated.
Open-source script
In true TradingView spirit, the creator of this script has made it open-source, so that traders can review and verify its functionality. Kudos to the author! While you can use it for free, remember that republishing the code is subject to our House Rules.
Disclaimer
The information and publications are not meant to be, and do not constitute, financial, investment, trading, or other types of advice or recommendations supplied or endorsed by TradingView. Read more in the Terms of Use.