Risk Criteria Score Histogram V2
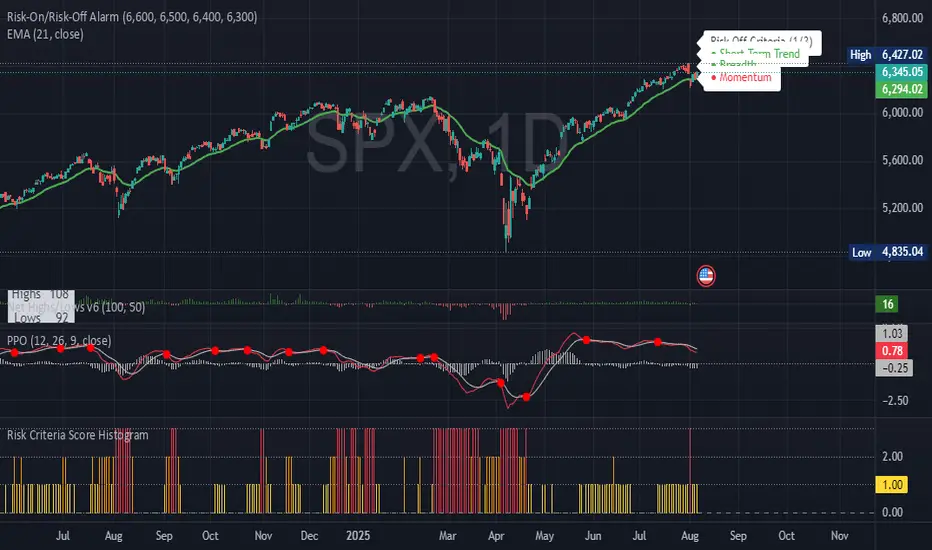
This indicator visualizes a daily risk score ranging from 0 to 3, based on three core market conditions:
Trend Risk – Activated when price is below the 20-day EMA.
Breadth Risk – Triggered when net new 52-week highs (NASDAQ + NYSE) are negative.
Momentum Risk – Flagged when the PPO histogram turns negative.
Each day, the script calculates how many of these criteria are signaling risk-off conditions. The result is plotted as a color-coded histogram:
🟩 0 – No risk signals (favorable environment)
🟨 1 – Mild caution
🟧 2 – Elevated risk
🟥 3 – All signals active (risk-off conditions)
This tool helps traders track shifts in market conditions and adjust exposure accordingly. Ideal for macro and swing trading perspectives.
Invite-only script
Only users approved by the author can access this script. You'll need to request and get permission to use it. This is typically granted after payment. For more details, follow the author's instructions below or contact Teclaro directly.
TradingView does NOT recommend paying for or using a script unless you fully trust its author and understand how it works. You may also find free, open-source alternatives in our community scripts.
Author's instructions
Disclaimer
Invite-only script
Only users approved by the author can access this script. You'll need to request and get permission to use it. This is typically granted after payment. For more details, follow the author's instructions below or contact Teclaro directly.
TradingView does NOT recommend paying for or using a script unless you fully trust its author and understand how it works. You may also find free, open-source alternatives in our community scripts.