OPEN-SOURCE SCRIPT
Upvol and Downvol
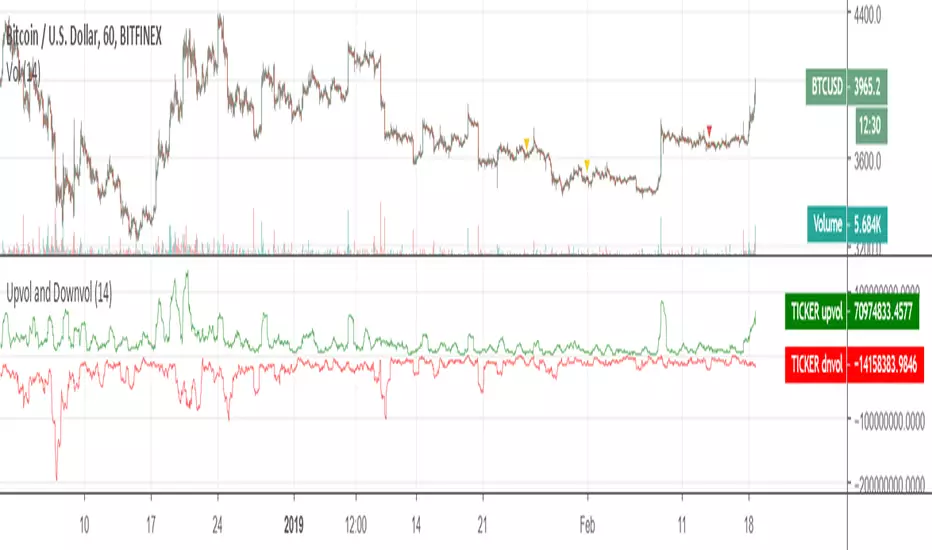
Upvolume and downvolume, calculated according to the MFI (Money Flow) formula, and shown separately.
The indicator has options for also showing NYSE upvolume and downvolume or ES1! (S&P500 upvolume/downvolume) along with the main ticker data, so you can compare them.
The chart can be analyzed by drawing trend lines, and can be surprisingly accurate.
~
The indicator has options for also showing NYSE upvolume and downvolume or ES1! (S&P500 upvolume/downvolume) along with the main ticker data, so you can compare them.
The chart can be analyzed by drawing trend lines, and can be surprisingly accurate.
~
Open-source script
In true TradingView spirit, the creator of this script has made it open-source, so that traders can review and verify its functionality. Kudos to the author! While you can use it for free, remember that republishing the code is subject to our House Rules.
Disclaimer
The information and publications are not meant to be, and do not constitute, financial, investment, trading, or other types of advice or recommendations supplied or endorsed by TradingView. Read more in the Terms of Use.