OPEN-SOURCE SCRIPT
Historical & Periodic Key Levels

Historical & Periodic Key Levels
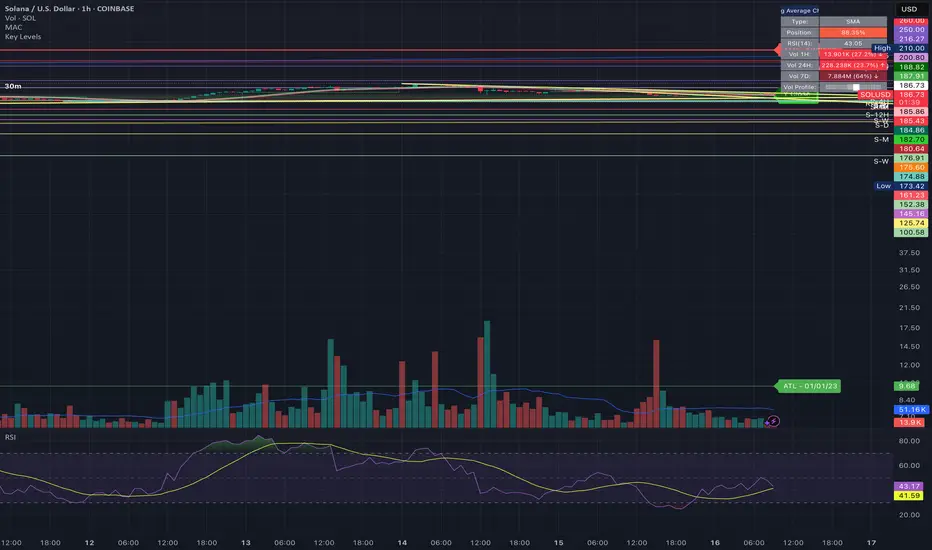
This indicator automatically plots historical key levels (ATH/ATL) and periodic closing levels (Daily, Weekly, Monthly, Yearly). It highlights major price zones frequently used in technical and institutional trading.
Key Features:
Usage:
Inputs:
Notes:
This indicator automatically plots historical key levels (ATH/ATL) and periodic closing levels (Daily, Weekly, Monthly, Yearly). It highlights major price zones frequently used in technical and institutional trading.
Key Features:
- Dynamic ATH/ATL: tracks all-time high/low with date annotation.
- Periodic Closes: previous D/W/M/Y closes with directional coloring.
- Adaptive Colors: green/red based on bullish or bearish close.
- Full Customization: toggle visibility, colors, line width, text alignment, and label text.
- Smart Label Management: prevents overlap by cycling through label styles automatically.
Usage:
- Identify strong support/resistance levels.
- Monitor key closing prices across multiple timeframes.
- Enhance swing trading and long-term analysis with institutional reference levels.
Inputs:
- Levels Visibility: show/hide ATH, ATL, and periodic closes.
- ATH/ATL Style Settings: line colors, label prefix, width, and text alignment.
- Periodic Levels Style: label text (D/W/M/Y), line width, alignment, and bullish/bearish colors.
Notes:
- Levels adjust automatically to the active chart timeframe.
- Lower timeframe levels are hidden when redundant (e.g., daily close on daily chart).
Open-source script
In true TradingView spirit, the creator of this script has made it open-source, so that traders can review and verify its functionality. Kudos to the author! While you can use it for free, remember that republishing the code is subject to our House Rules.
Disclaimer
The information and publications are not meant to be, and do not constitute, financial, investment, trading, or other types of advice or recommendations supplied or endorsed by TradingView. Read more in the Terms of Use.