OPEN-SOURCE SCRIPT
TREND 123
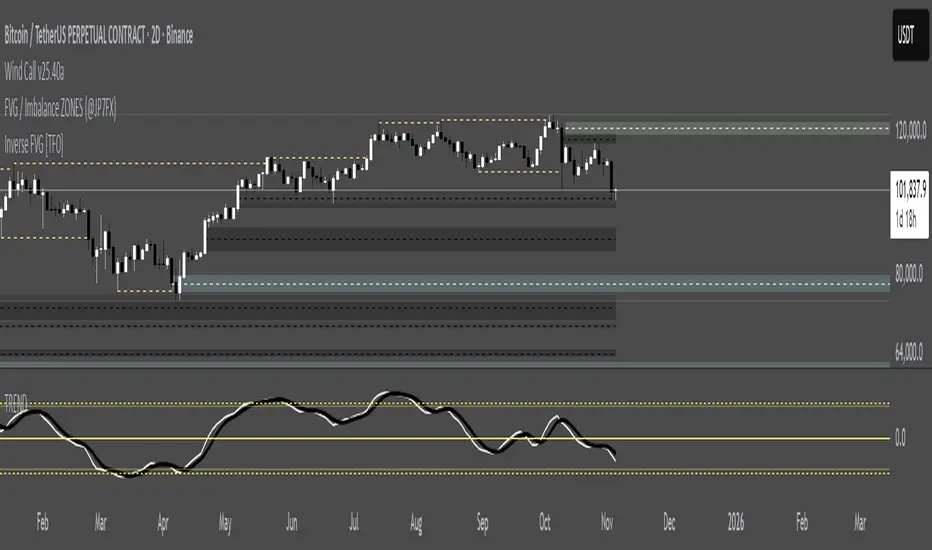
### TREND - Wave Trend Oscillator (Optimized)
This indicator is an optimized version of the classic Wave Trend Oscillator, a powerful tool for identifying market momentum, overbought/oversold conditions, and potential trend shifts. Built on the foundational work of LazyBear, this script has been refined for clarity and enhanced with key features to provide a more comprehensive trading view.
#### Key Features and Functionality
The indicator plots two primary lines, WT1 (Wave Trend 1) and WT2 (Wave Trend 2), in a separate pane below the price chart.
,
Momentum and Trend Identification:
,
WT1 (Blue Line): Represents the faster-moving component, reflecting immediate market momentum.
,
WT2 (Orange Line): Acts as a signal line, a smoothed version of WT1.
,
Crossovers: A cross of WT1 above WT2 is typically interpreted as a bullish signal, while a cross below WT2 suggests a bearish signal.
,
Overbought and Oversold Zones:
The script includes four configurable horizontal lines to define critical zones: two for ,
Overbought (e.g., +60 and +53) and two for Oversold (e.g., -60 and -53).
When the WT lines enter the Overbought zone, it signals that the asset may be due for a pullback. Conversely, entering the Oversold zone suggests a potential bounce.,
,
Sensitivity Control:
A unique ,
Sensitivity Factor input allows users to fine-tune the oscillator's responsiveness to price changes. A lower factor makes the indicator more sensitive, while a higher factor provides smoother, less volatile readings.
,
Visual Enhancements (Configurable):
,
Histogram: An optional histogram plots the difference between WT1 and WT2. This visual aid helps gauge the strength of the current momentum—the larger the bar, the stronger the trend in that direction.
,
Information Table: An optional, dynamic table is displayed on the chart, providing a quick, real-time summary of the indicator's status, including:
,
Current State: Neutral, Overbought (), or Oversold ().
,
Trend: Bullish () or Bearish (), based on the WT1/WT2 crossover.
The current values of WT1 and WT2.,
#### How to Use It
This indicator is best used as a confirmation tool alongside price action or other trend-following indicators.
Open-source script
In true TradingView spirit, the creator of this script has made it open-source, so that traders can review and verify its functionality. Kudos to the author! While you can use it for free, remember that republishing the code is subject to our House Rules.
Disclaimer
The information and publications are not meant to be, and do not constitute, financial, investment, trading, or other types of advice or recommendations supplied or endorsed by TradingView. Read more in the Terms of Use.