felci
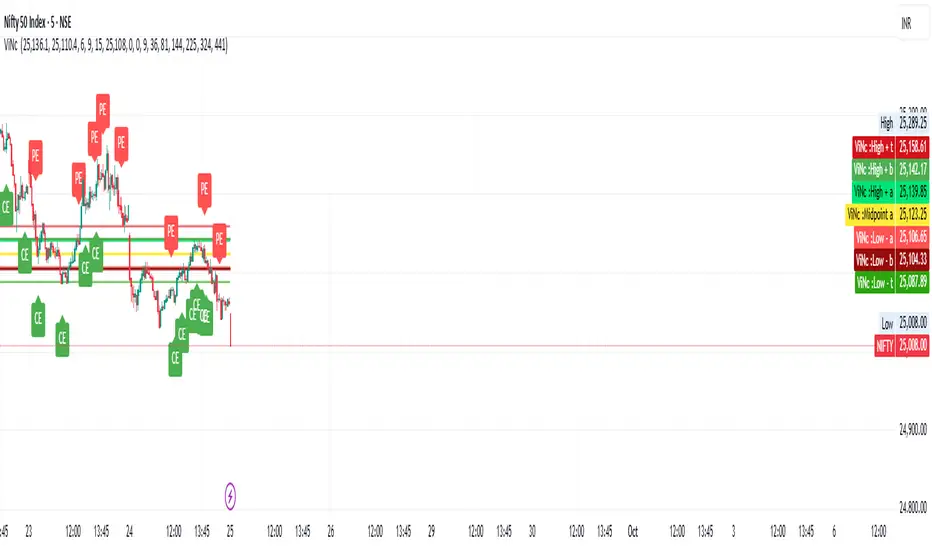
The second row shows LOW values of NIFTY.
Some values are negative (like -2058, -300, -486)—these could indicate changes or differences rather than absolute index values.
The table seems color-coded in the image: green, orange, and light colors—probably to highlight ranges or thresholds.
Invite-only script
Only users approved by the author can access this script. You'll need to request and get permission to use it. This is typically granted after payment. For more details, follow the author's instructions below or contact vincent_march88 directly.
TradingView does NOT recommend paying for or using a script unless you fully trust its author and understand how it works. You may also find free, open-source alternatives in our community scripts.
Author's instructions
Disclaimer
Invite-only script
Only users approved by the author can access this script. You'll need to request and get permission to use it. This is typically granted after payment. For more details, follow the author's instructions below or contact vincent_march88 directly.
TradingView does NOT recommend paying for or using a script unless you fully trust its author and understand how it works. You may also find free, open-source alternatives in our community scripts.