OPEN-SOURCE SCRIPT
Updated % Divergence of RSI

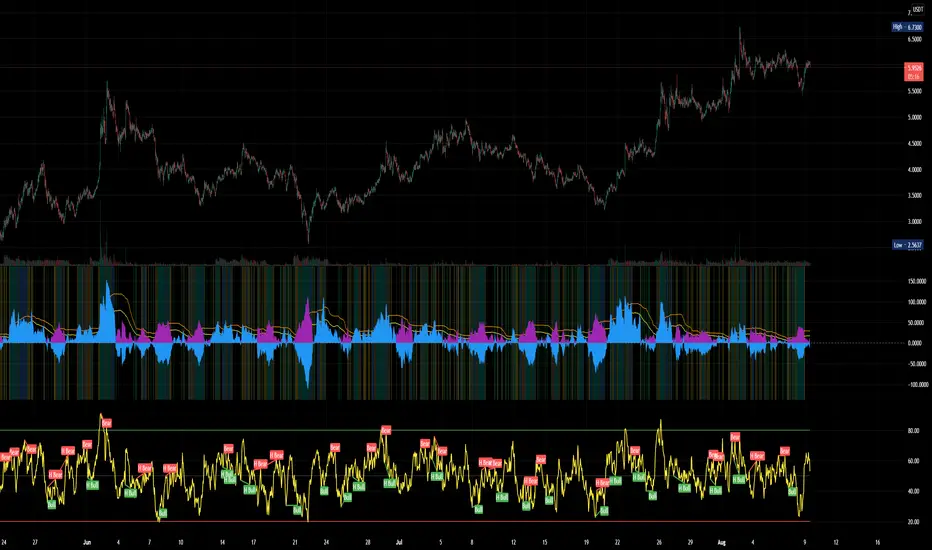
A simple script that plots the difference between the %ROC of price vs the %ROC of RSI, AKA the % of divergence. A simple way to analyze how strong a potential divergence is. Top reversals are above 0, bottom reversals are below. A value of 0 means price and RSI are changing by the same % value. So, if oscillator is moving up as price moves up, it means divergence is increasing. If oscillator moves down as price moves up, it means divergence is decreasing.
Release Notes
Better default values.Release Notes
Finalized? I probably uploaded this too early. Oh well...+ absolute value underlay
+ color highlights based on Bollinger Band.
+ purple > 0 is buy signal, blue > 0 is sell signal. ABS shown to more easily compare strength of all divergences.
+ best buys are when background highlighted blue or teal - in upper bollinger band range or broke out, stronger divergences!
+ BB crosses shown in orange and yellow like the respective lines
+ Crosses of 0 line highlighted in green and lime.
Release Notes
better value and chartRelease Notes
fixed rangeOpen-source script
In true TradingView spirit, the creator of this script has made it open-source, so that traders can review and verify its functionality. Kudos to the author! While you can use it for free, remember that republishing the code is subject to our House Rules.
Disclaimer
The information and publications are not meant to be, and do not constitute, financial, investment, trading, or other types of advice or recommendations supplied or endorsed by TradingView. Read more in the Terms of Use.
Open-source script
In true TradingView spirit, the creator of this script has made it open-source, so that traders can review and verify its functionality. Kudos to the author! While you can use it for free, remember that republishing the code is subject to our House Rules.
Disclaimer
The information and publications are not meant to be, and do not constitute, financial, investment, trading, or other types of advice or recommendations supplied or endorsed by TradingView. Read more in the Terms of Use.