OPEN-SOURCE SCRIPT
D_ELI (Ehlers Leading Indicator)
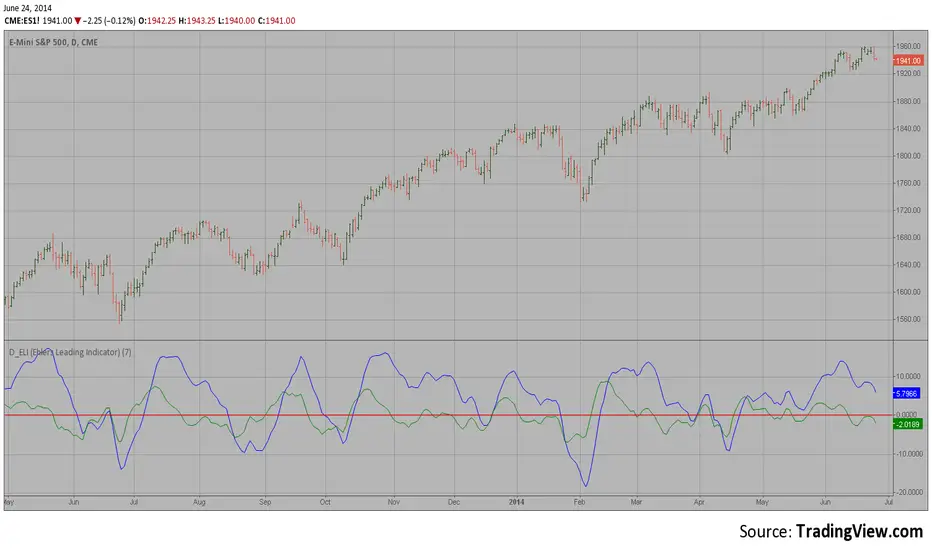
This Indicator plots a single
Daily DSP (Detrended Synthetic Price) and a Daily ELI (Ehlers Leading
Indicator) using intraday data.
Detrended Synthetic Price is a function that is in phase with the dominant
cycle of real price data. This one is computed by subtracting a 3 pole Butterworth
filter from a 2 Pole Butterworth filter. Ehlers Leading Indicator gives an advanced
indication of a cyclic turning point. It is computed by subtracting the simple
moving average of the detrended synthetic price from the detrended synthetic price.
Buy and Sell signals arise when the ELI indicator crosses over or under the detrended
synthetic price.
See "MESA and Trading Market Cycles" by John Ehlers pages 64 - 70.
Open-source script
In true TradingView spirit, the creator of this script has made it open-source, so that traders can review and verify its functionality. Kudos to the author! While you can use it for free, remember that republishing the code is subject to our House Rules.
Disclaimer
The information and publications are not meant to be, and do not constitute, financial, investment, trading, or other types of advice or recommendations supplied or endorsed by TradingView. Read more in the Terms of Use.