OPEN-SOURCE SCRIPT
Old Price Oscillator

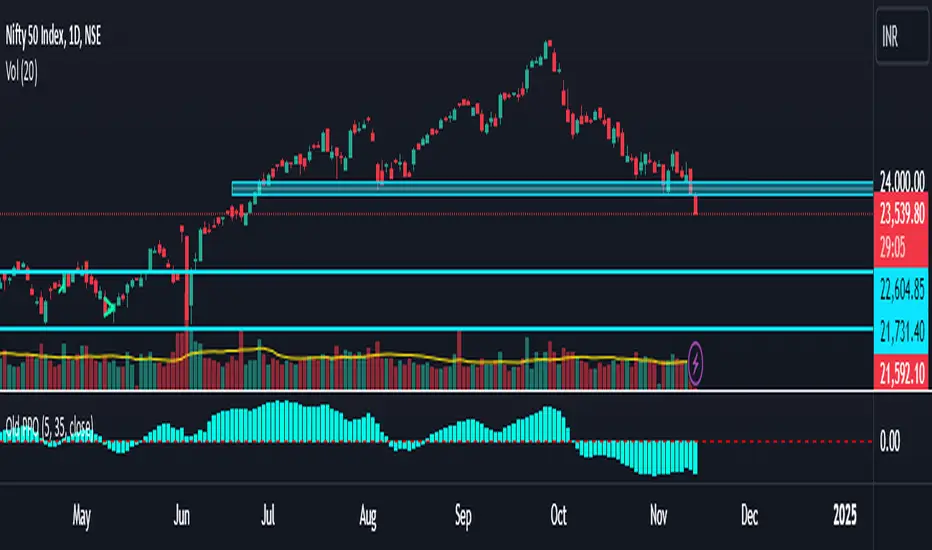
The Old Price Oscillator (OPO) is a momentum indicator widely used by traders and analysts to gauge the direction and strength of price trends. It works by calculating the difference between two moving averages—a shorter-term moving average and a longer-term moving average—of a security’s price. This difference is plotted as an oscillating line, helping traders visualize the momentum and determine when price reversals or continuations might occur. Typically, when the oscillator value is positive, the price is trending upwards, suggesting potential buy signals; conversely, when the oscillator turns negative, it indicates downward momentum, which could signal a potential sell.
The OPO is similar to other oscillators, like the Moving Average Convergence Divergence (MACD), in that it uses moving averages to smooth out price fluctuations and clarify trends. Traders often customize the length of the short- and long-term moving averages to better suit specific assets or market conditions. Generally, this indicator is especially useful in markets that exhibit clear trends. However, it may generate false signals during sideways or highly volatile periods, so many traders combine the OPO with other technical indicators or filters to improve accuracy.
The OPO is similar to other oscillators, like the Moving Average Convergence Divergence (MACD), in that it uses moving averages to smooth out price fluctuations and clarify trends. Traders often customize the length of the short- and long-term moving averages to better suit specific assets or market conditions. Generally, this indicator is especially useful in markets that exhibit clear trends. However, it may generate false signals during sideways or highly volatile periods, so many traders combine the OPO with other technical indicators or filters to improve accuracy.
Open-source script
In true TradingView spirit, the creator of this script has made it open-source, so that traders can review and verify its functionality. Kudos to the author! While you can use it for free, remember that republishing the code is subject to our House Rules.
Disclaimer
The information and publications are not meant to be, and do not constitute, financial, investment, trading, or other types of advice or recommendations supplied or endorsed by TradingView. Read more in the Terms of Use.