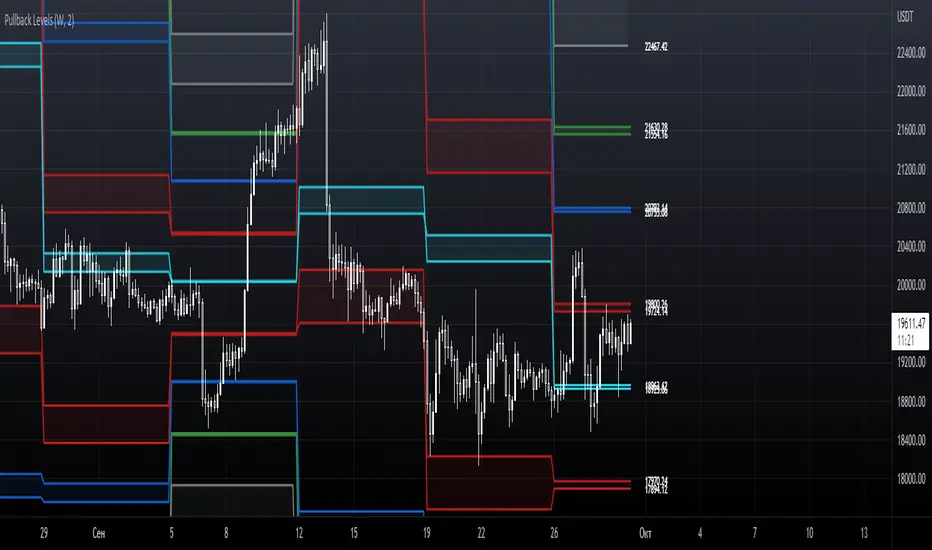
Pullback Levels

Analysis of support and resistance levels often coincides with the action levels of large players, similar to the analysis of a trend line. When analyzing Pullback levels, the first support and resistance levels are calculated using the width of the trading range and the volume traded during this period. The second support and resistance levels are calculated using the larger trading range width given the highs and lows.
It also provides the ability to flexibly adjust the levels, their visualization, style, calculation methods and the used timeframe. For the convenience of backtesting, all historical levels are saved on the chart. To analyze current price movements and determine pullbacks, all prices are displayed next to the levels.
-------------------------------------------
Pullback levels – технический индикатор для прогнозирования крупных ценовых движений путем расчета уровней поддержки и сопротивления. Используется для определения общего рыночного тренда на различных таймфреймах. Pullback levels используются при построение цены выше или ниже них, указывая на приоритетное направление движения.
Анализ уровней поддержки и сопротивления часто совпадает с уровнями действия крупных игроков, наподобие анализа трендовой линии. При анализе Pullback уровней первые уровни поддержки и сопротивления рассчитываются с использованием ширины торгового диапазона и объёмом проторгованным за этот период. Вторые уровни поддержки и сопротивления рассчитываются с использованием более старшей ширины торгового диапазона учитывая максимумы и минимумы.
Он так же предоставляет возможность гибкой настройки уровней - их визуальной составляющей, стиля, методов расчёта и используемого таймфрейма. Для удобства бэктестинга все исторические уровни сохраняются на графике. Для анализа текущих ценовых движений и определении точек разворота, все цены находятся рядом с уровнями.
Now you can also change both the color of the line price and the background between the levels.
-------------------------------------------
Обновленная версия индикатора Pullback Levels предоставляет возможность анализировать рыночную ситуацию в более широком диапазоне посредством изменения отображения уровней. В новой версии обновился метод расчета уровней и теперь они представляют собой полосу с настраиваемой шириной в процентном соотношении, что помогает лучше определять торговый диапазон для более точного подбора точек входа и расположения уровней поддержки и сопротивления.
Появилась возможность изменять как цвет цены линий, так и заливки между уровнями.
-------------------------------------------
Новая версия индикатора имеет в себе динамическую основу расчета для более эффективного определения диапазонов. Поддержки и сопротивления это обычно некий диапазон, а не строго определенный горизонтальный уровень и поэтому индикатор определяет динамические зоны для анализа рынка.
Performance optimized and some tooltips with hints added.
-------------------------------------------
Обновлен до Pine Script версии 5.
Оптимизирована производительность и добавлены некоторые подсказки в настройках.
-------------------------------------------
Добавлено больше интервалов для расчета уровней. Теперь он позволяет находить более сильные и высокие уровни, такие как 3 месяца, 6 месяцев и 12 месяцев, для анализа более широких рынков, таких как акции.
-------------------------------------------
Исправление багов при отображении уровней.
Invite-only script
Only users approved by the author can access this script. You'll need to request and get permission to use it. This is typically granted after payment. For more details, follow the author's instructions below or contact CryptoLevels directly.
TradingView does NOT recommend paying for or using a script unless you fully trust its author and understand how it works. You may also find free, open-source alternatives in our community scripts.
Author's instructions
🔊 Ежедневные разборы в канале: t.me/cryptolevels_ru
Disclaimer
Invite-only script
Only users approved by the author can access this script. You'll need to request and get permission to use it. This is typically granted after payment. For more details, follow the author's instructions below or contact CryptoLevels directly.
TradingView does NOT recommend paying for or using a script unless you fully trust its author and understand how it works. You may also find free, open-source alternatives in our community scripts.
Author's instructions
🔊 Ежедневные разборы в канале: t.me/cryptolevels_ru