OPEN-SOURCE SCRIPT
Updated Volume Support & Resistance multi timeframe [LM]
Hello guys,
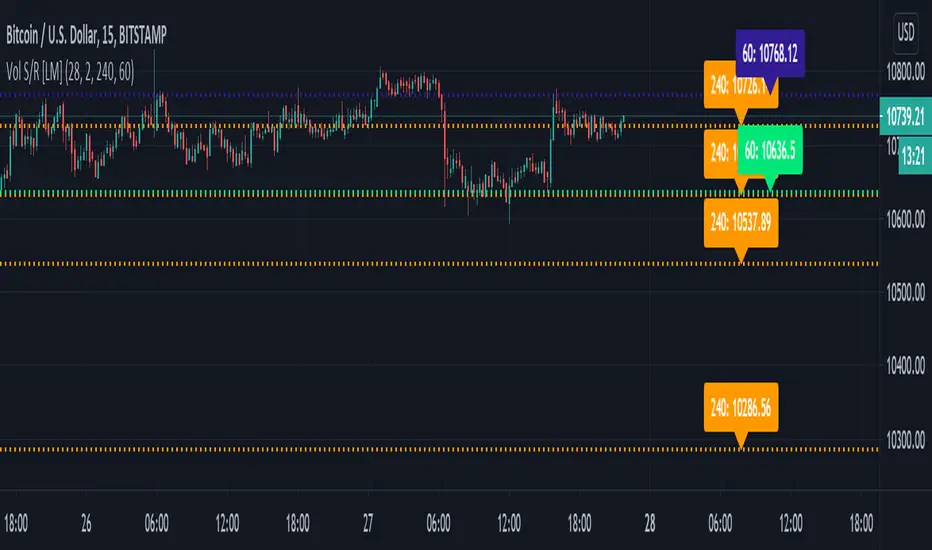
I would like to introduce you volume support and resistance horizontals. It draws line horizontal on high and low high volume candles that has volume above volume MA for certain period multiplied by multiplier and also the volume is increasing from previous volume . You can select lines on this timeframe and/or another one.
The colors are dynamic depending whether price is below or above the line:
for the current timeframe green is used for support and blue for resistance
for the other timeframe by default 4h orange is used for support and violet for resistance
There are various sections in setting:
volume - here you can select SMA volume length and multiplier
show and hide section of the current timeframe
other timeframe
show and hide other timeframe horizontals
I'm mainly looking smaller timeframe and trading higher timeframe from level to level
Any suggestions are welcome
Release Notes
fixing multi timeframe behaviorRelease Notes
adding another timeframe and labels for valuesRelease Notes
update to version 5Open-source script
In true TradingView spirit, the creator of this script has made it open-source, so that traders can review and verify its functionality. Kudos to the author! While you can use it for free, remember that republishing the code is subject to our House Rules.
Disclaimer
The information and publications are not meant to be, and do not constitute, financial, investment, trading, or other types of advice or recommendations supplied or endorsed by TradingView. Read more in the Terms of Use.
Open-source script
In true TradingView spirit, the creator of this script has made it open-source, so that traders can review and verify its functionality. Kudos to the author! While you can use it for free, remember that republishing the code is subject to our House Rules.
Disclaimer
The information and publications are not meant to be, and do not constitute, financial, investment, trading, or other types of advice or recommendations supplied or endorsed by TradingView. Read more in the Terms of Use.