Sicari Stress Map - Flash Crash / Stabilising Detection Engine
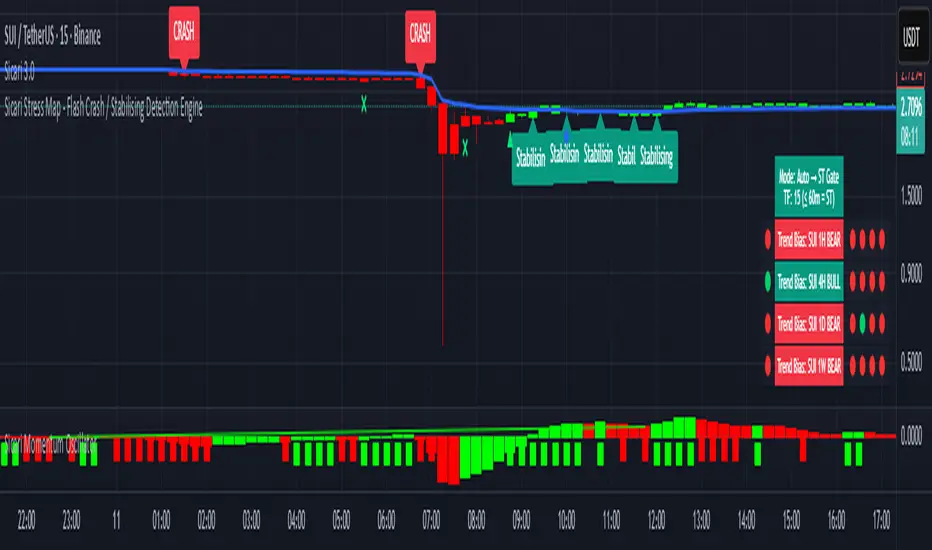
Most “flash-crash” legs start with a local stress shock on a small timeframe (5-min works well):
- a burst in true range (high TR percentile),
- short-term vol jumps vs long-term (RV ratio),
- bands expand and price snaps below fast EMA,
- often a quick reflex bid (buy-the-dip) for a few 5-min candles…
…and then the main liquidation leg hits.
This engine keys off that first shock on 5m and bubbles it up to your chart TF as a single FLASHCRASH pulse. Then it watches for Stabilising, when panic fades:
- ATR compresses,
- BB width z goes negative (pinch),
- ranges shrink,
- structure improves (≥ fast EMA by default).
Invite-only script
Only users approved by the author can access this script. You'll need to request and get permission to use it. This is typically granted after payment. For more details, follow the author's instructions below or contact damianawright directly.
TradingView does NOT recommend paying for or using a script unless you fully trust its author and understand how it works. You may also find free, open-source alternatives in our community scripts.
Author's instructions
Disclaimer
Invite-only script
Only users approved by the author can access this script. You'll need to request and get permission to use it. This is typically granted after payment. For more details, follow the author's instructions below or contact damianawright directly.
TradingView does NOT recommend paying for or using a script unless you fully trust its author and understand how it works. You may also find free, open-source alternatives in our community scripts.