PROTECTED SOURCE SCRIPT
Quantura - Liquidity Sweep & Run Levels
Introduction
“Quantura – Liquidity Sweep & Run Levels” is a structural price-action indicator designed to automatically detect swing-based liquidity zones and visualize potential sweep and run events. It helps traders identify areas where liquidity has likely been taken (sweep) or released (run), improving precision in market structure analysis and timing of entries or exits.
Originality & Value
This tool translates institutional liquidity concepts into an automated visual framework. Instead of simply marking highs and lows, it dynamically monitors swing points, tracks their breaches, and identifies subsequent reactions. The indicator is built to highlight the liquidity dynamics that often precede reversals or continuations.
Its originality lies in:
Functionality & Core Logic
Parameters & Customization
Visualization & Display
Use Cases
Limitations & Recommendations
Markets & Timeframes
Optimized for all major asset classes — including crypto, Forex, indices, and equities — and for intraday to higher-timeframe structural analysis (5-minute up to daily charts).
Author & Access
Developed 100% by Quantura. Published as a protected source script indicator. Access is free.
Compliance Note
This description fully complies with TradingView’s Script Publishing Rules and House Rules. It avoids performance claims, provides transparency on methodology, and clearly describes indicator behavior and limitations.
“Quantura – Liquidity Sweep & Run Levels” is a structural price-action indicator designed to automatically detect swing-based liquidity zones and visualize potential sweep and run events. It helps traders identify areas where liquidity has likely been taken (sweep) or released (run), improving precision in market structure analysis and timing of entries or exits.
Originality & Value
This tool translates institutional liquidity concepts into an automated visual framework. Instead of simply marking highs and lows, it dynamically monitors swing points, tracks their breaches, and identifies subsequent reactions. The indicator is built to highlight the liquidity dynamics that often precede reversals or continuations.
Its originality lies in:
- Automatic identification and tracking of swing highs and lows.
- Real-time detection of broken levels and liquidity sweeps.
- Distinction between “Run” and “Sweep” modes for different market behaviors.
- Persistent historical visualization of liquidity levels using clean line structures.
- Configurable signal markers for bullish and bearish sweep confirmations.
Functionality & Core Logic
- Detects swing highs and lows using a user-defined Swing Length parameter.
- Stores and updates all swing levels dynamically with arrays for efficient memory handling.
- Draws horizontal lines from each detected swing point to visualize potential liquidity zones.
- Monitors when price breaks a swing level and marks that event as “broken.”
- Generates signals when the market either sweeps above/below or runs away from those levels, depending on the chosen mode.
- Provides optional visual signal markers (“▲” for bullish sweeps, “▼” for bearish sweeps).
Parameters & Customization
- Mode: Choose between “Sweep” (detects liquidity grabs) or “Run” (detects breakout continuations).
- Swing Length: Sets the sensitivity for detecting swing highs/lows. A higher value focuses on larger structures, while smaller values detect micro liquidity points.
- Bullish Color / Bearish Color: Customize color themes for sweep/run lines and signal markers.
- Signals: Enables or disables visual up/down markers for confirmed events.
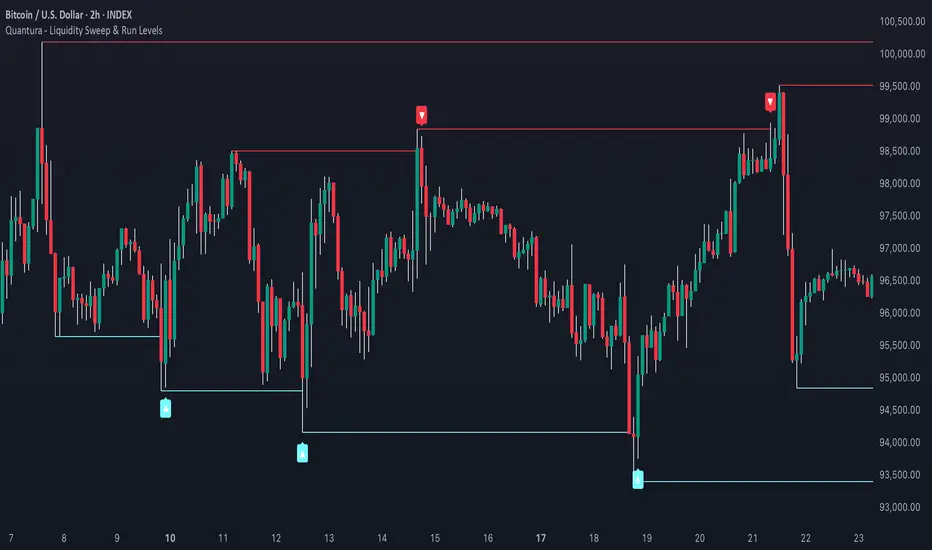
Visualization & Display
- Horizontal lines represent potential liquidity levels (unbroken swing highs/lows).
- Once broken, lines automatically stop extending, marking the moment liquidity is taken.
- Depending on the selected mode:
“Sweep” mode identifies false breaks or stop-hunt behavior.
“Run” mode highlights breakouts that continue the trend. - Colored arrows indicate the direction and type of liquidity reaction.
- Clean, non-intrusive visualization suitable for overlaying on price charts.
Use Cases
- Detect liquidity sweeps before major reversals.
- Identify breakout continuations after liquidity runs.
- Combine with Supply/Demand or FVG indicators for multi-layered confirmation.
- Validate liquidity bias in algorithmic or discretionary strategies.
- Analyze market manipulation patterns and institutional stop-hunting behavior.
Limitations & Recommendations
- This indicator identifies structural behavior but does not guarantee trade direction or profitability.
- Works best on liquid markets with clear swing structures (e.g., crypto, forex, indices).
- Signal interpretation should be combined with confluence tools such as volume, order flow, or structure-based filters.
- Excessively small swing settings may cause over-signaling in volatile markets.
Markets & Timeframes
Optimized for all major asset classes — including crypto, Forex, indices, and equities — and for intraday to higher-timeframe structural analysis (5-minute up to daily charts).
Author & Access
Developed 100% by Quantura. Published as a protected source script indicator. Access is free.
Compliance Note
This description fully complies with TradingView’s Script Publishing Rules and House Rules. It avoids performance claims, provides transparency on methodology, and clearly describes indicator behavior and limitations.
Protected script
This script is published as closed-source. However, you can use it freely and without any limitations – learn more here.
Get instant access at quantura.io/
Disclaimer
The information and publications are not meant to be, and do not constitute, financial, investment, trading, or other types of advice or recommendations supplied or endorsed by TradingView. Read more in the Terms of Use.