PROTECTED SOURCE SCRIPT
candle stats v1
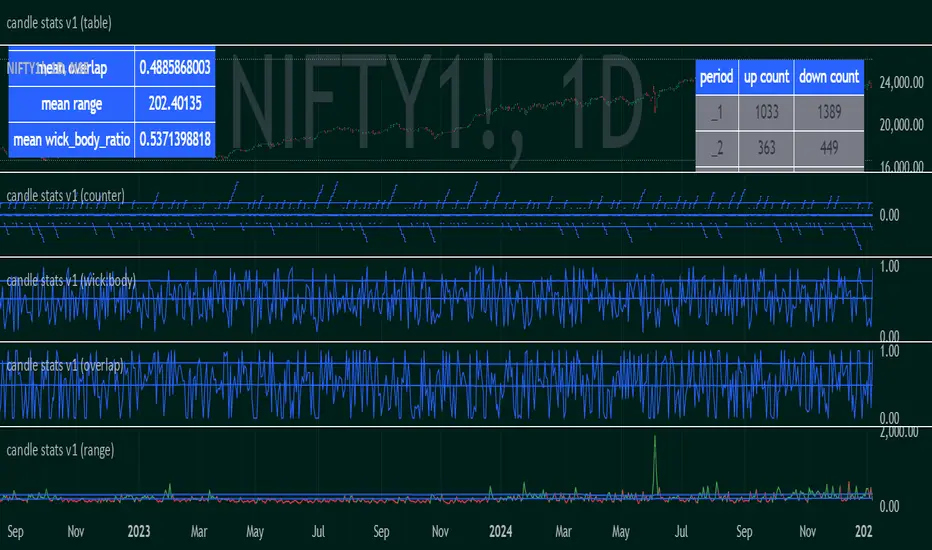
Objective:
Capture sequential/subsequent candle's relative properties
Average observations to represent the landscape of the marketplace
Parameters:
"range" : high-low
"overlap" : range - range[1]
"wick_body_ratio" : (range - abs(open-close))/range
"up_count" for "period" : number of occurrences where <period> consecutive candles have low>low[i+1]. (note: the values are not cumulative over period)
*"down_count" for "period" : number of occurrences where <period> consecutive candles have high<high[i+1]. (note: the values are not cumulative over period)
** the last counter includes the value for "period" and all above
Basic inferences:
mean_range could be used to derive at an appropriate hard-stoploss
high wick to body ratio indicates healthy buzzing market, ie, each candle has a high frequency standing wave within it. a lower value indicates that the timeframe is ordered and highly directional
low overlap indicates trend definition/resolution
the counters show how likely or unlikely a run up or run down of a particular length is
a combination of counter and mean_range could be used to derive at an appropriate take profit
Use case:
to determine the appropriate timeframe to develop or apply a strategy
Future enhancements:
more complex relationships such as higher highs and lower lows
frequency of oscillations
Protected script
This script is published as closed-source. However, you can use it freely and without any limitations – learn more here.
Disclaimer
The information and publications are not meant to be, and do not constitute, financial, investment, trading, or other types of advice or recommendations supplied or endorsed by TradingView. Read more in the Terms of Use.