OPEN-SOURCE SCRIPT
Relative Strength vs SPX

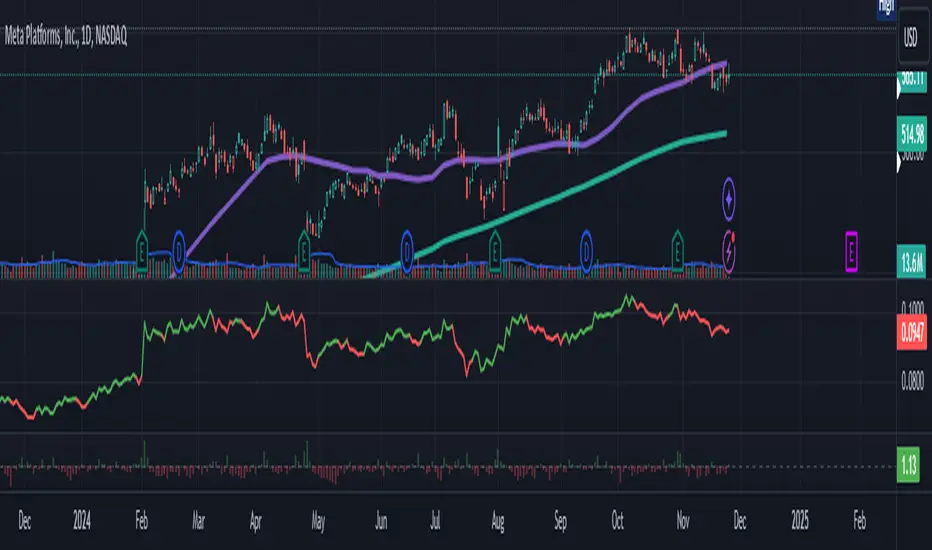
This indicator calculates the ratio of the current chart's price to the S&P 500 Index (SPX), providing a measure of the stock's relative strength compared to the broader market.
Key Features:
Dynamic High/Low Detection: Highlights periods when the ratio makes a new high (green) or a new low (red) based on a user-defined lookback period.
Customizable Lookback: The lookback period for detecting highs and lows can be adjusted in the settings for tailored analysis.
Visual Overlay: The ratio is plotted in a separate pane, allowing easy comparison of relative strength trends.
This tool is useful for identifying stocks outperforming or underperforming the S&P 500 over specific timeframes.
Open-source script
In true TradingView spirit, the creator of this script has made it open-source, so that traders can review and verify its functionality. Kudos to the author! While you can use it for free, remember that republishing the code is subject to our House Rules.
Disclaimer
The information and publications are not meant to be, and do not constitute, financial, investment, trading, or other types of advice or recommendations supplied or endorsed by TradingView. Read more in the Terms of Use.