PROTECTED SOURCE SCRIPT
rsi_Miguel

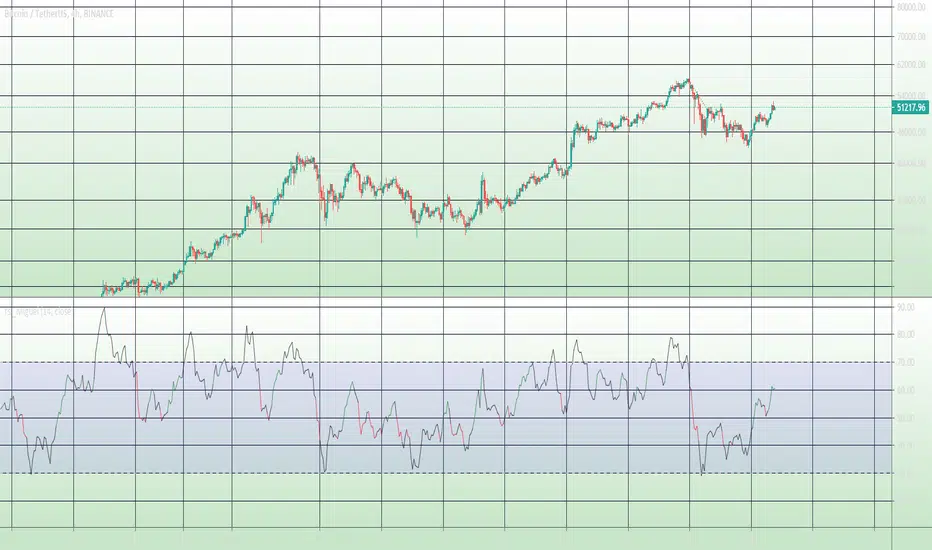
Slightly different RSI . It is shown the Ema RSI with leght 2 in order to clean some "noise" and become easier to read. It shows in green possible "buy moments" and in red possible "Sell moments". Those are calculared with a slower and a faster ema ( rsi ). It is the RSI that I use and hope it helps someone.
Protected script
This script is published as closed-source. However, you can use it freely and without any limitations – learn more here.
Disclaimer
The information and publications are not meant to be, and do not constitute, financial, investment, trading, or other types of advice or recommendations supplied or endorsed by TradingView. Read more in the Terms of Use.